Data Chops
Digging through datasets or making my own
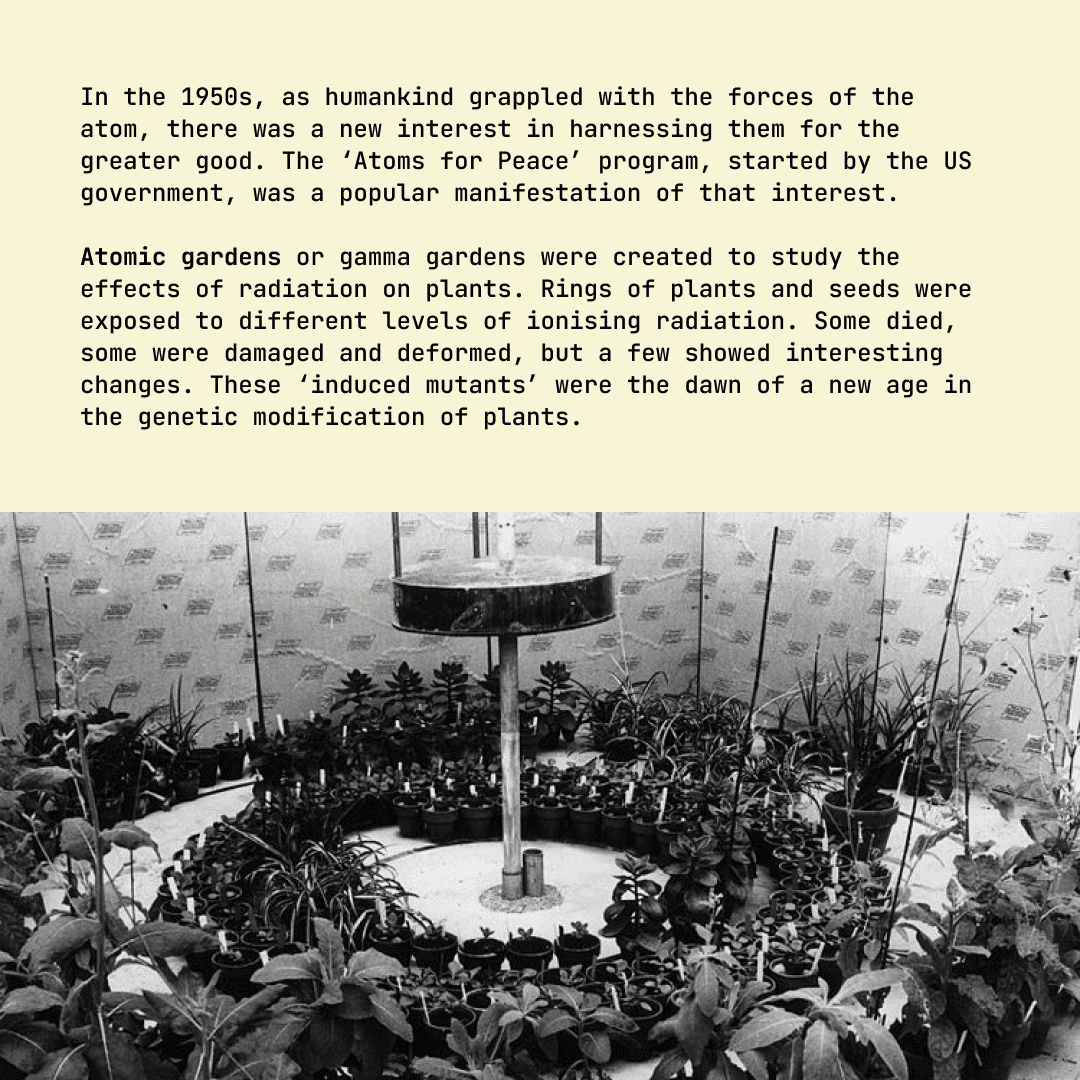
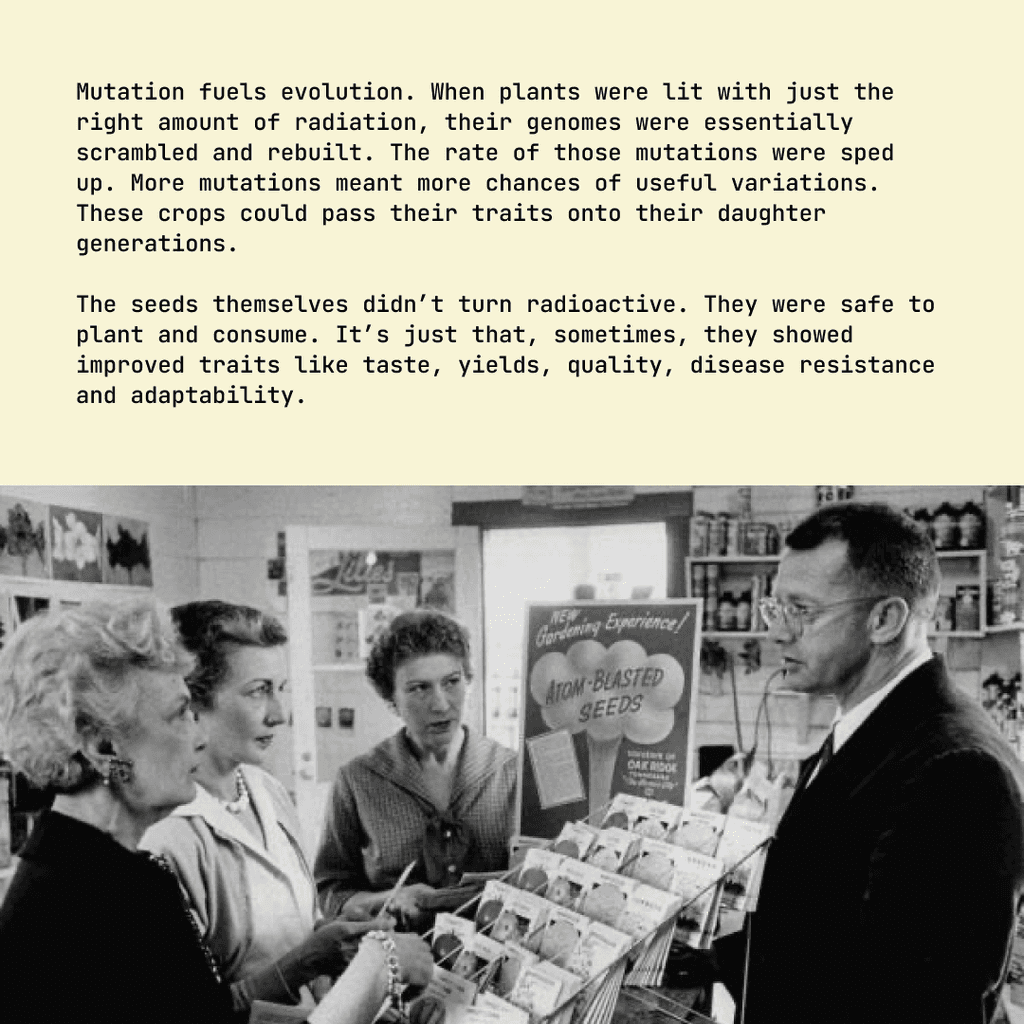
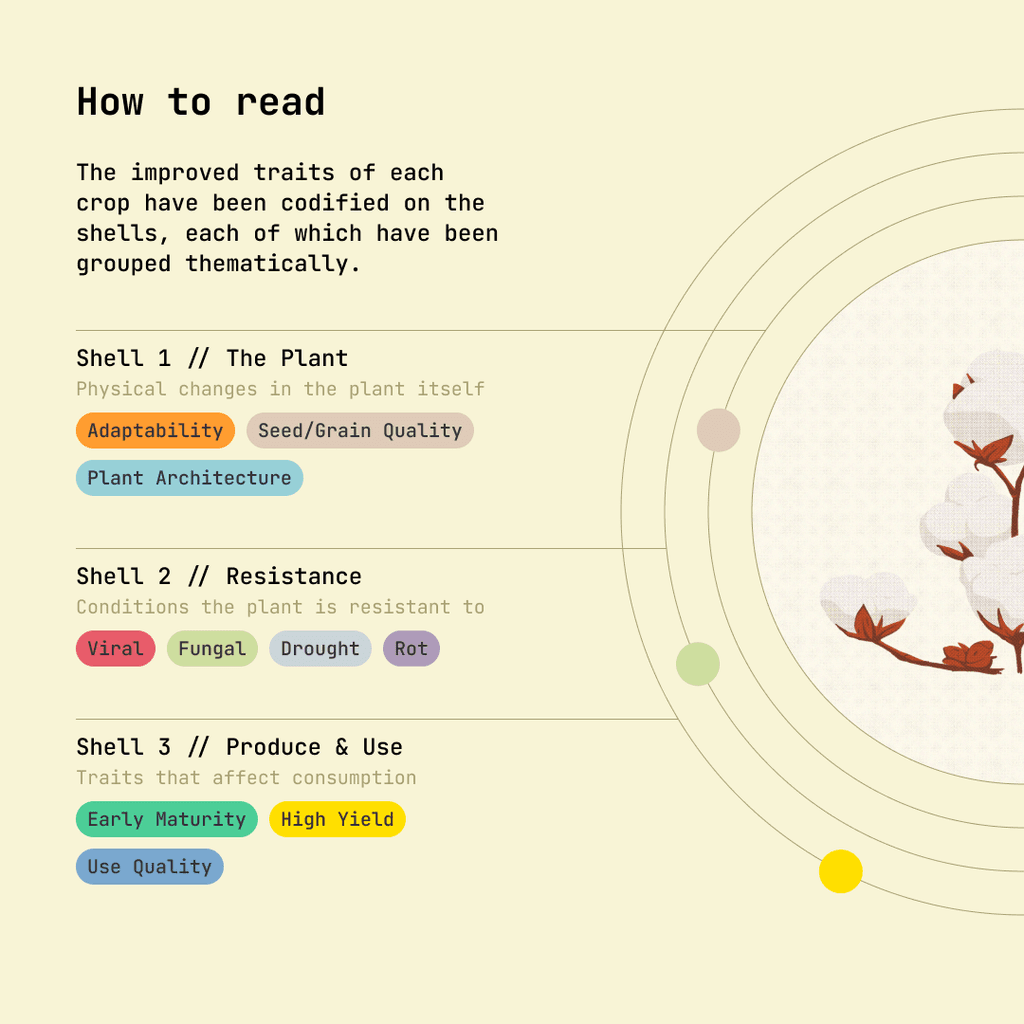
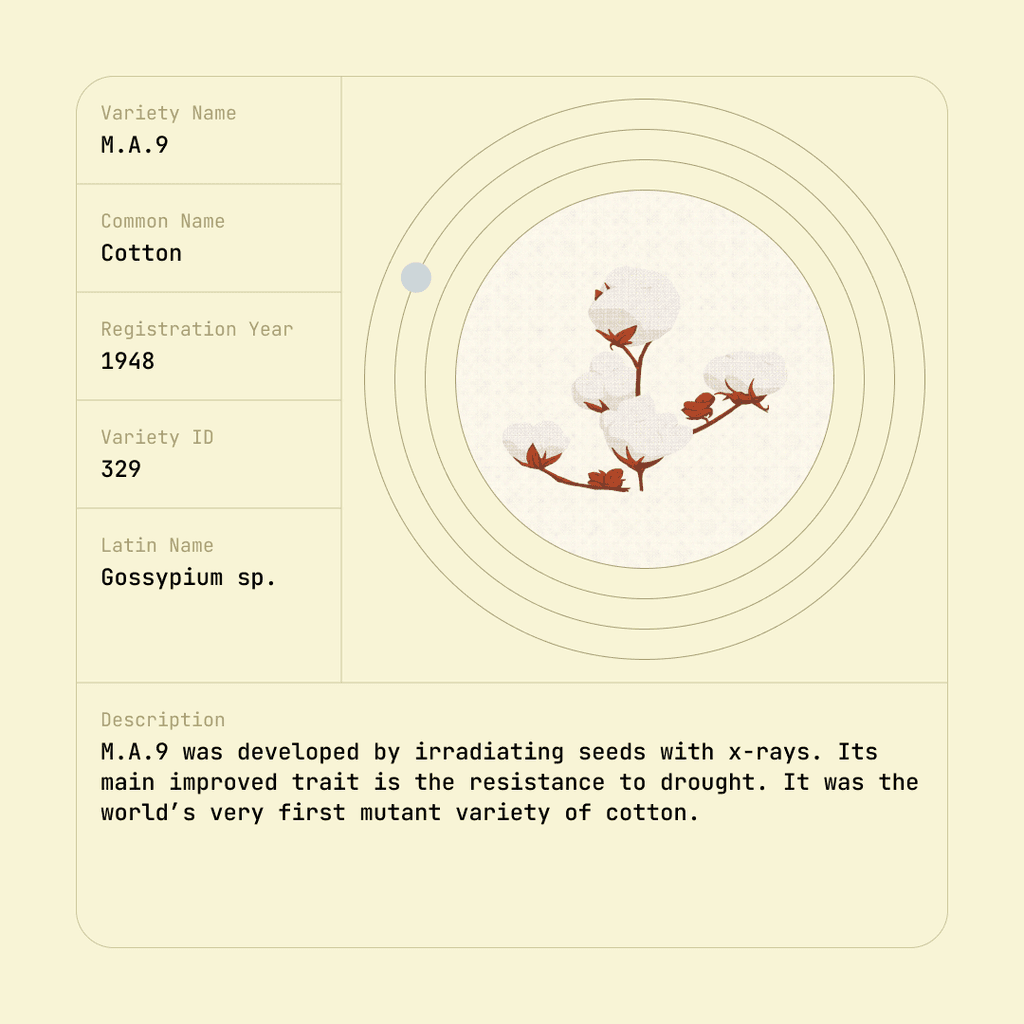
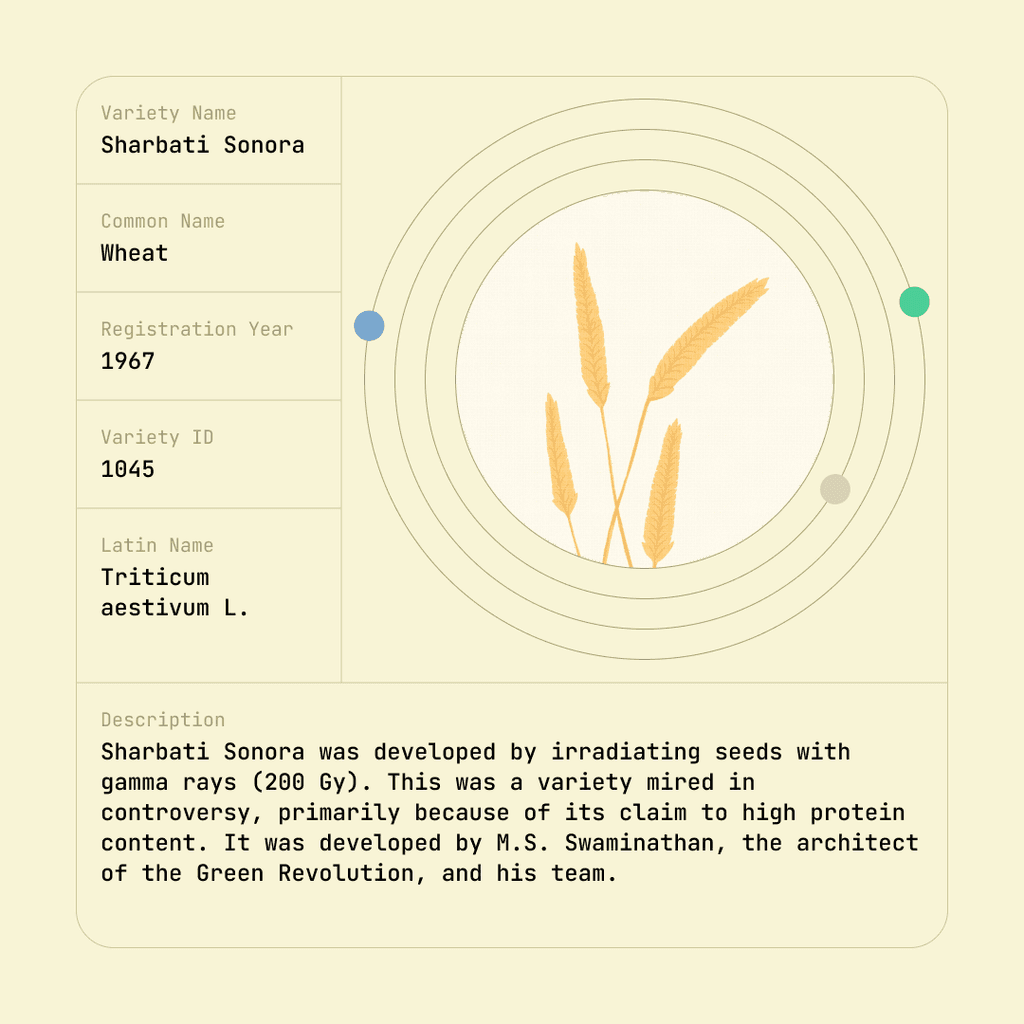
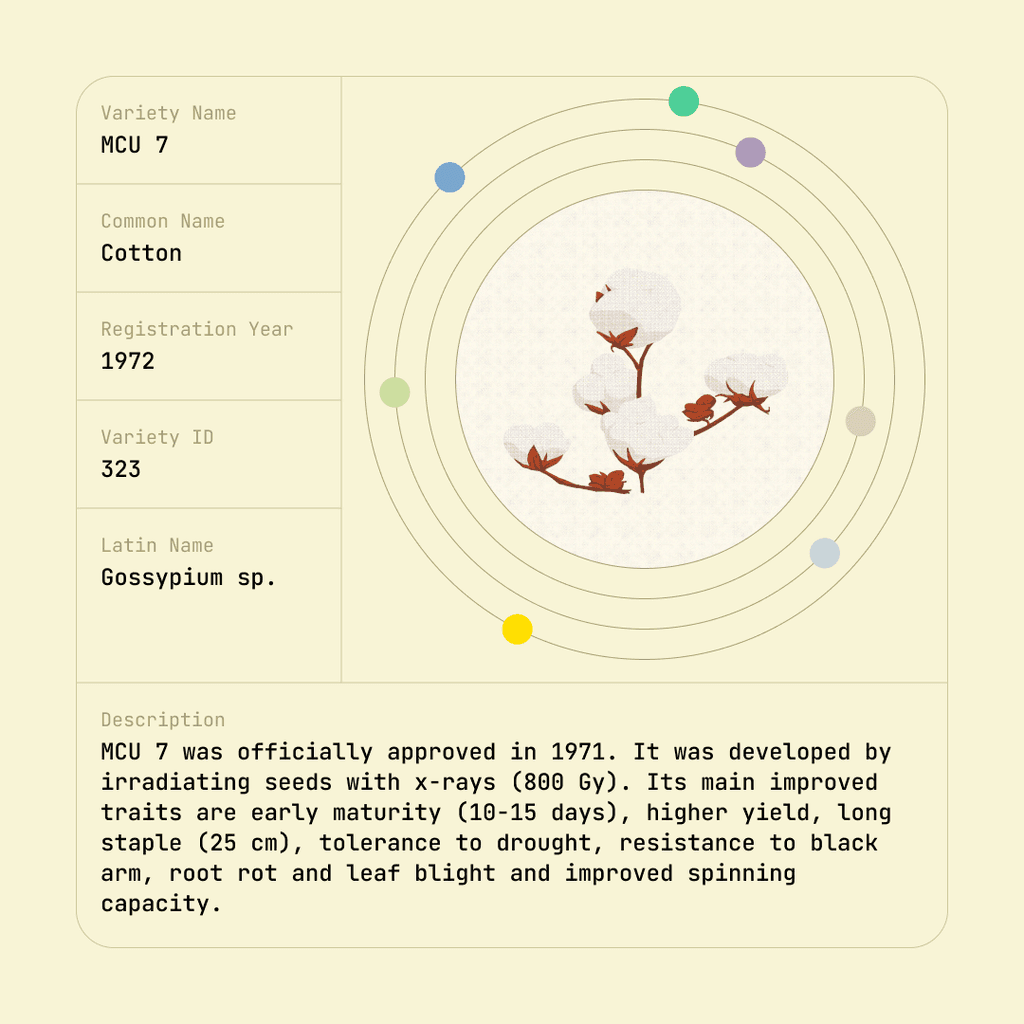
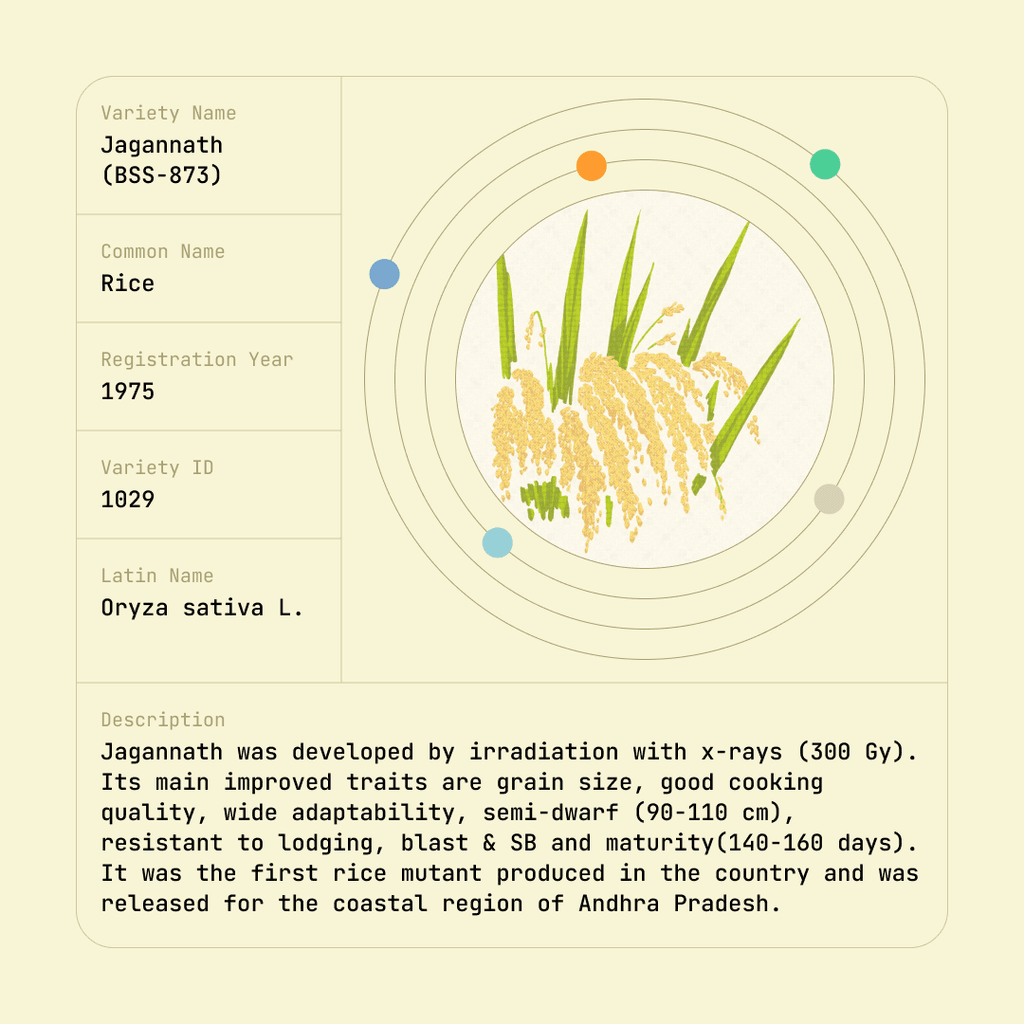
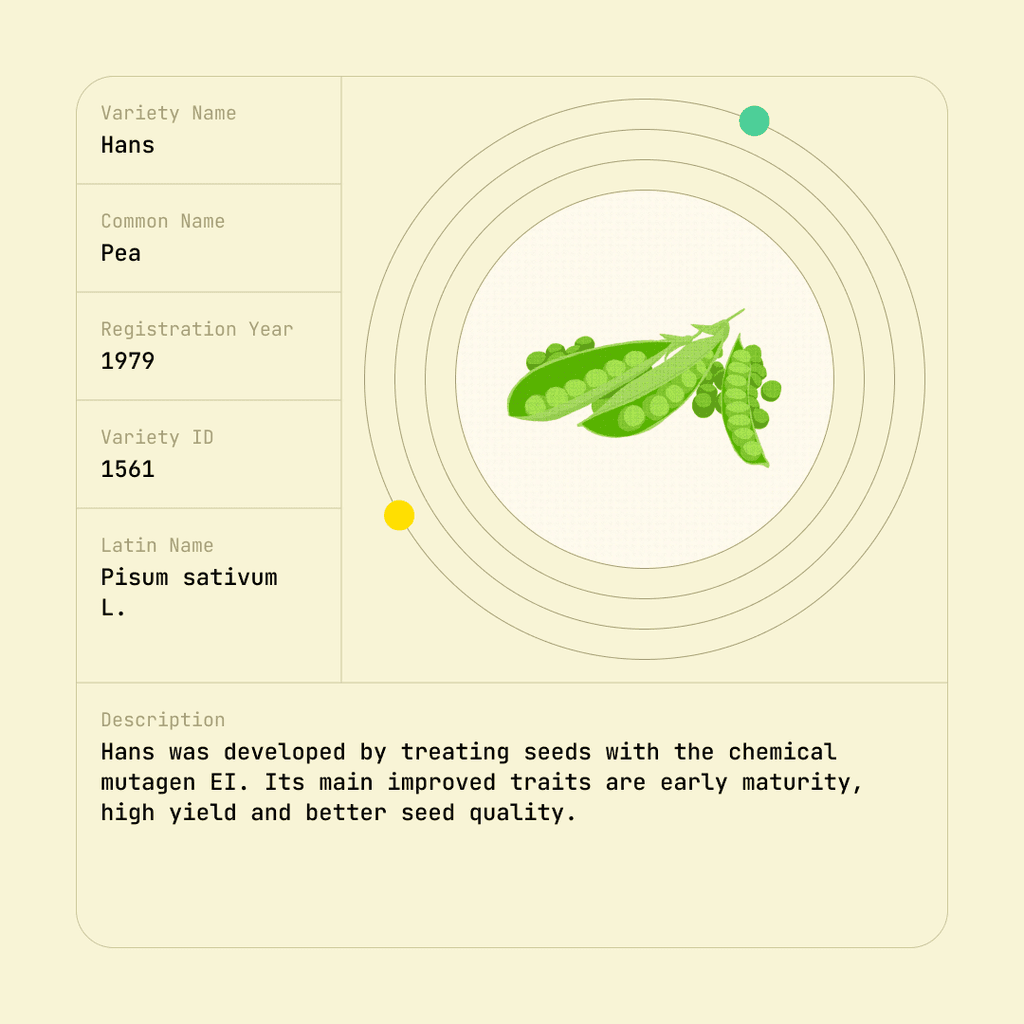
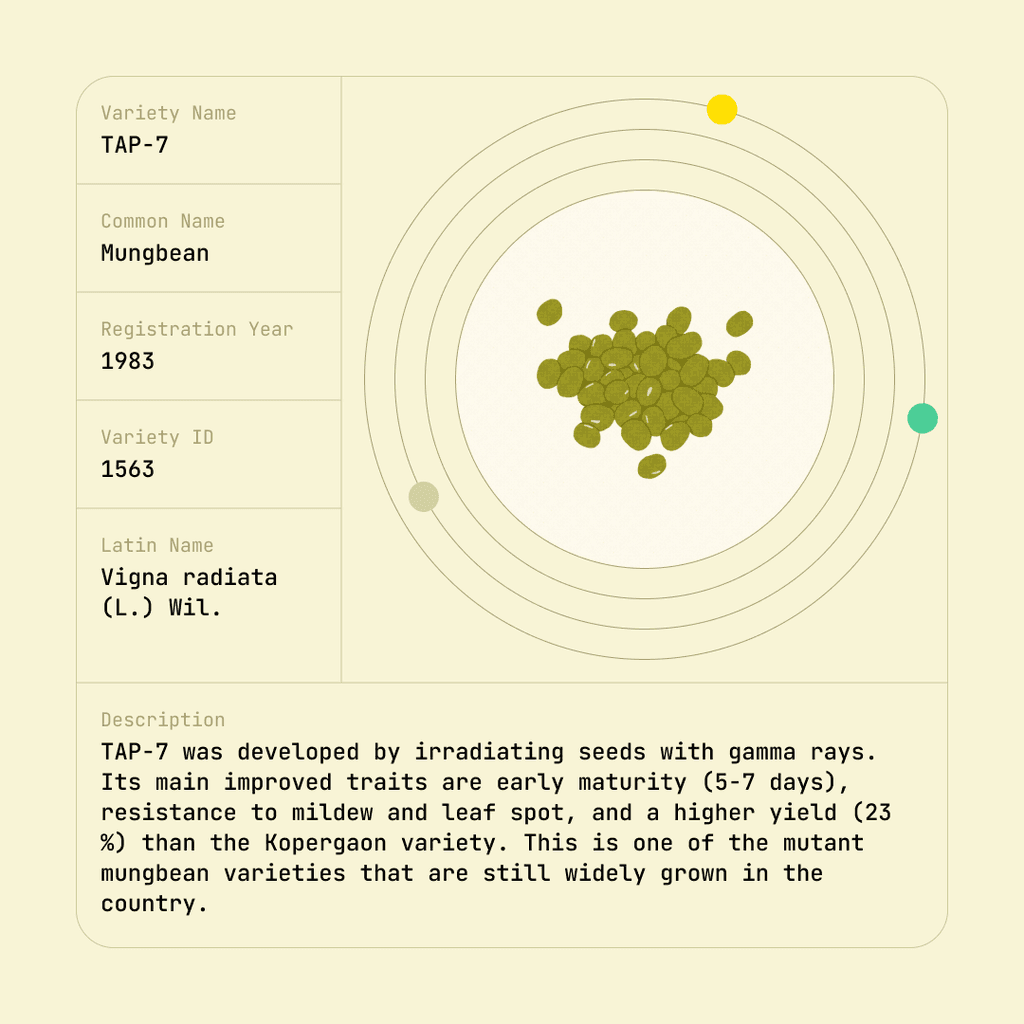
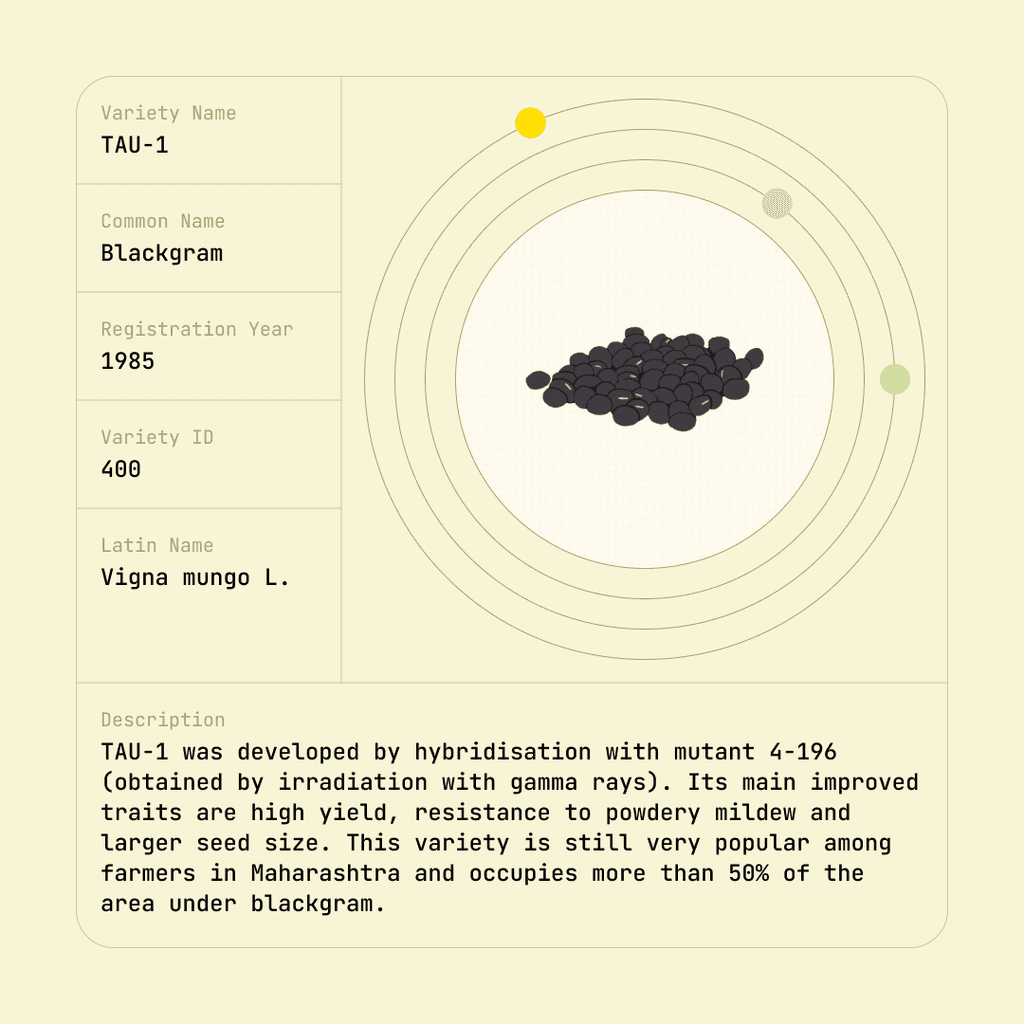
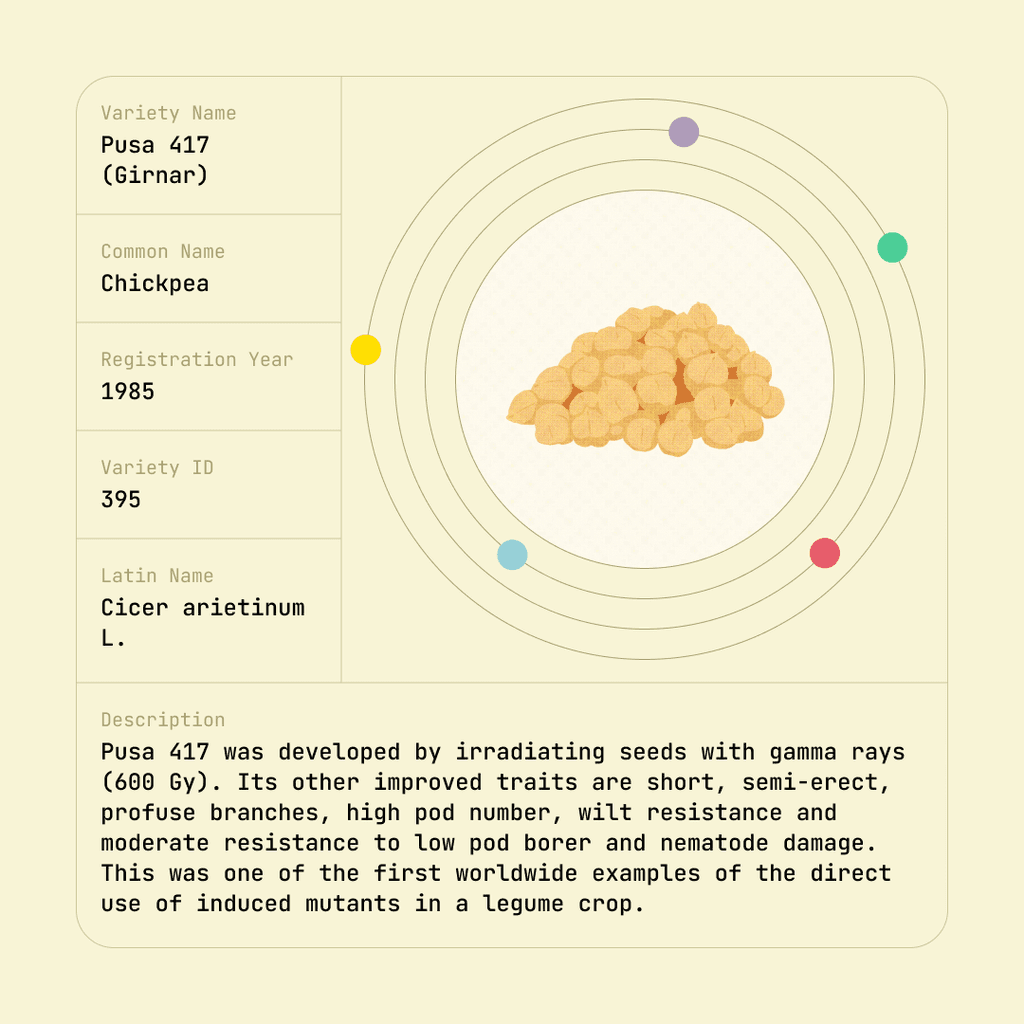
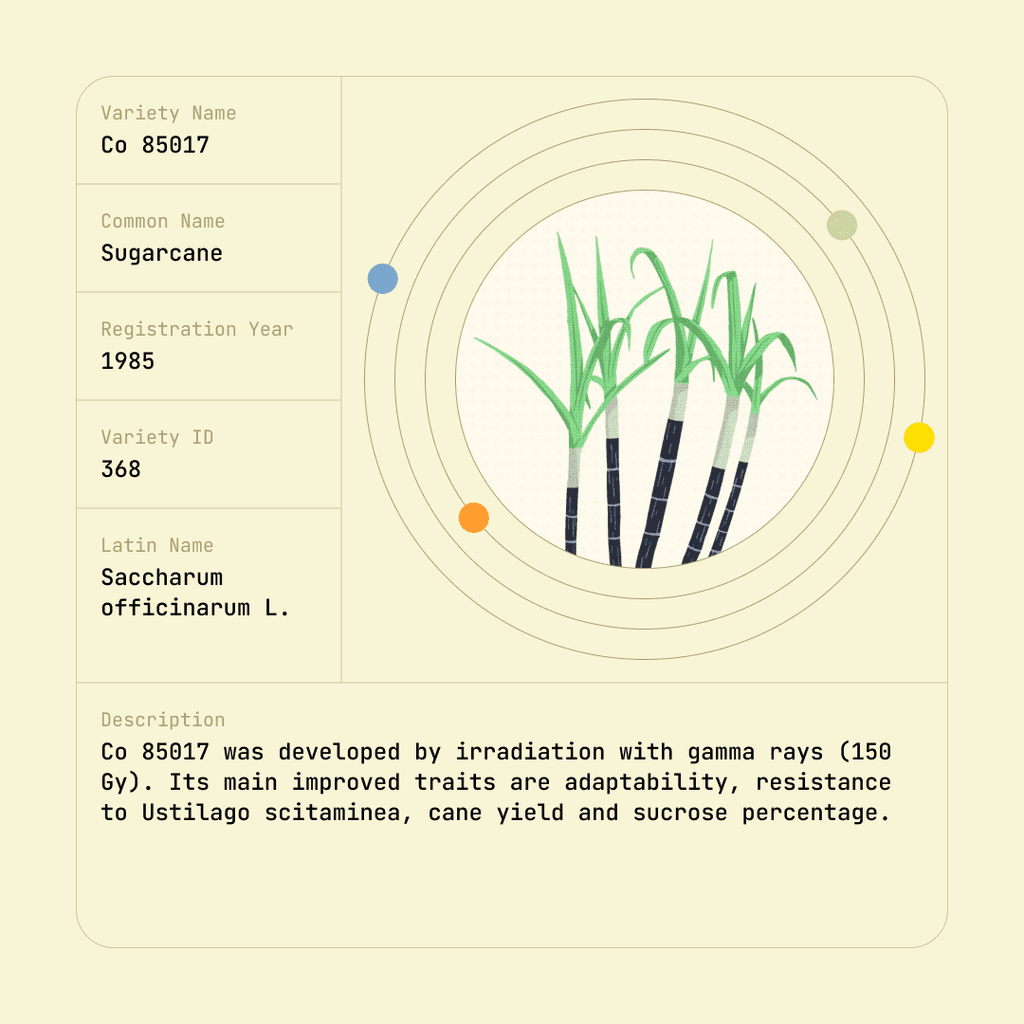
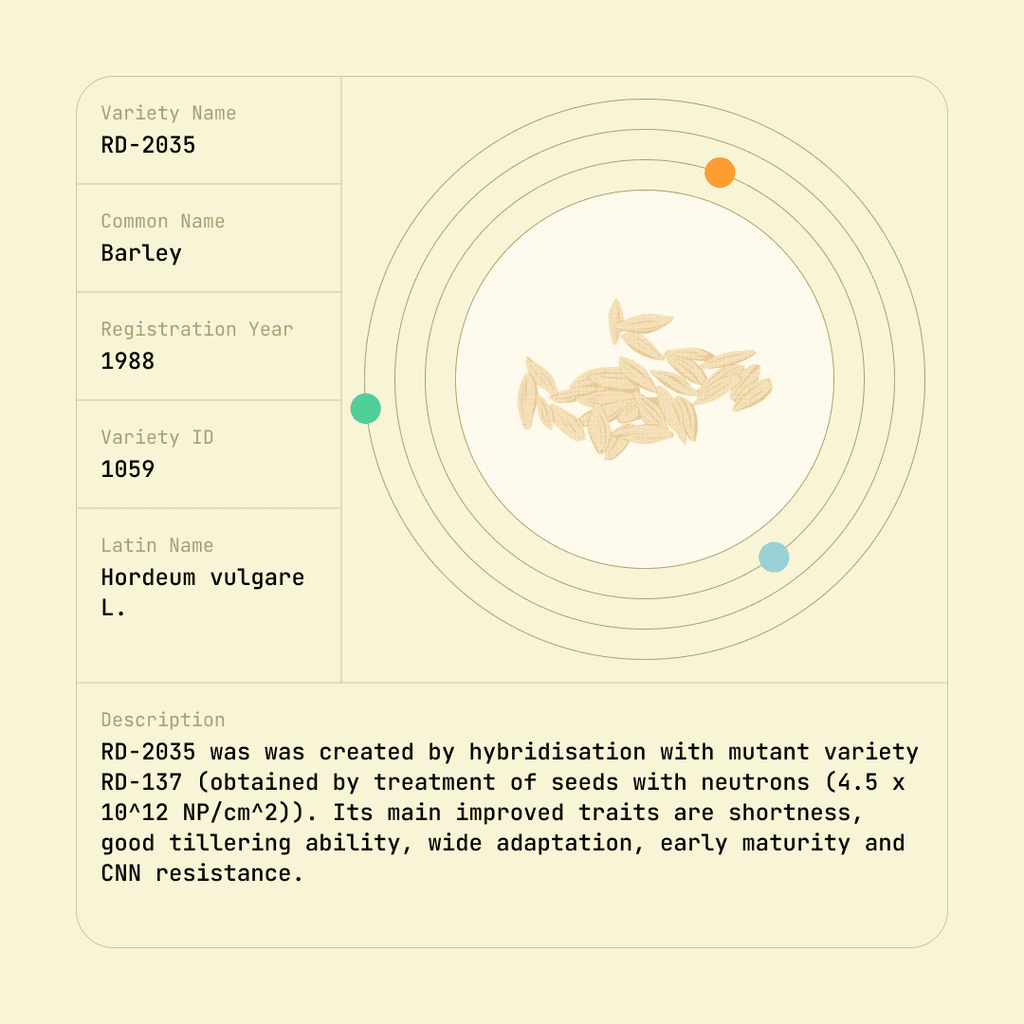
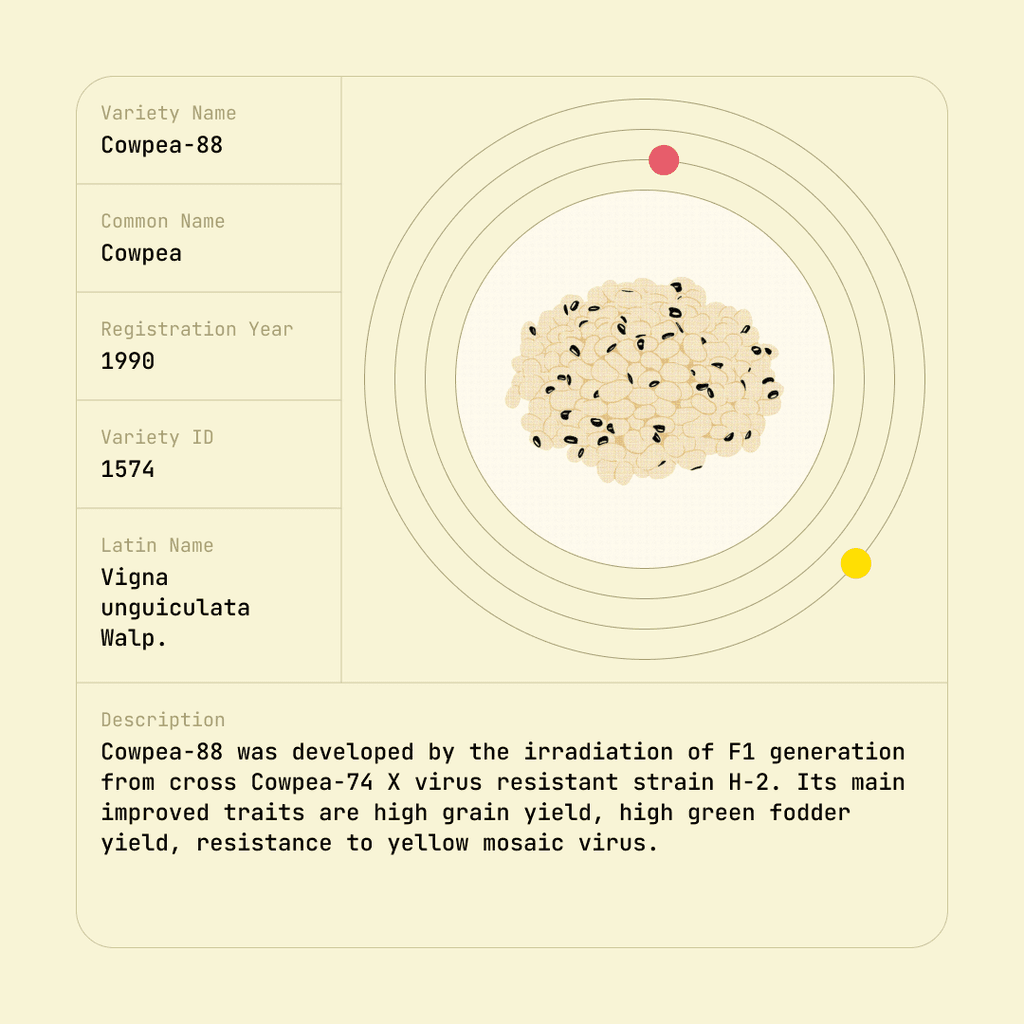
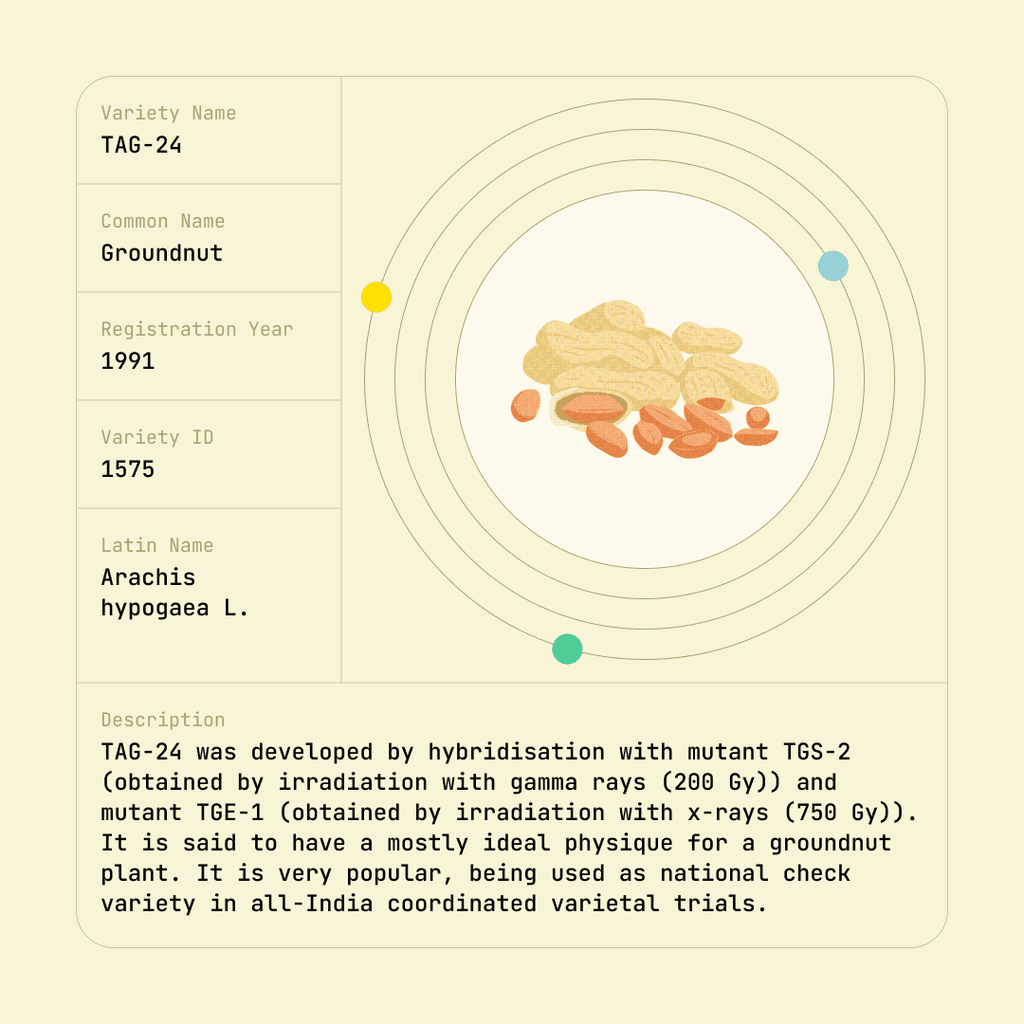
Fruits of the Atom


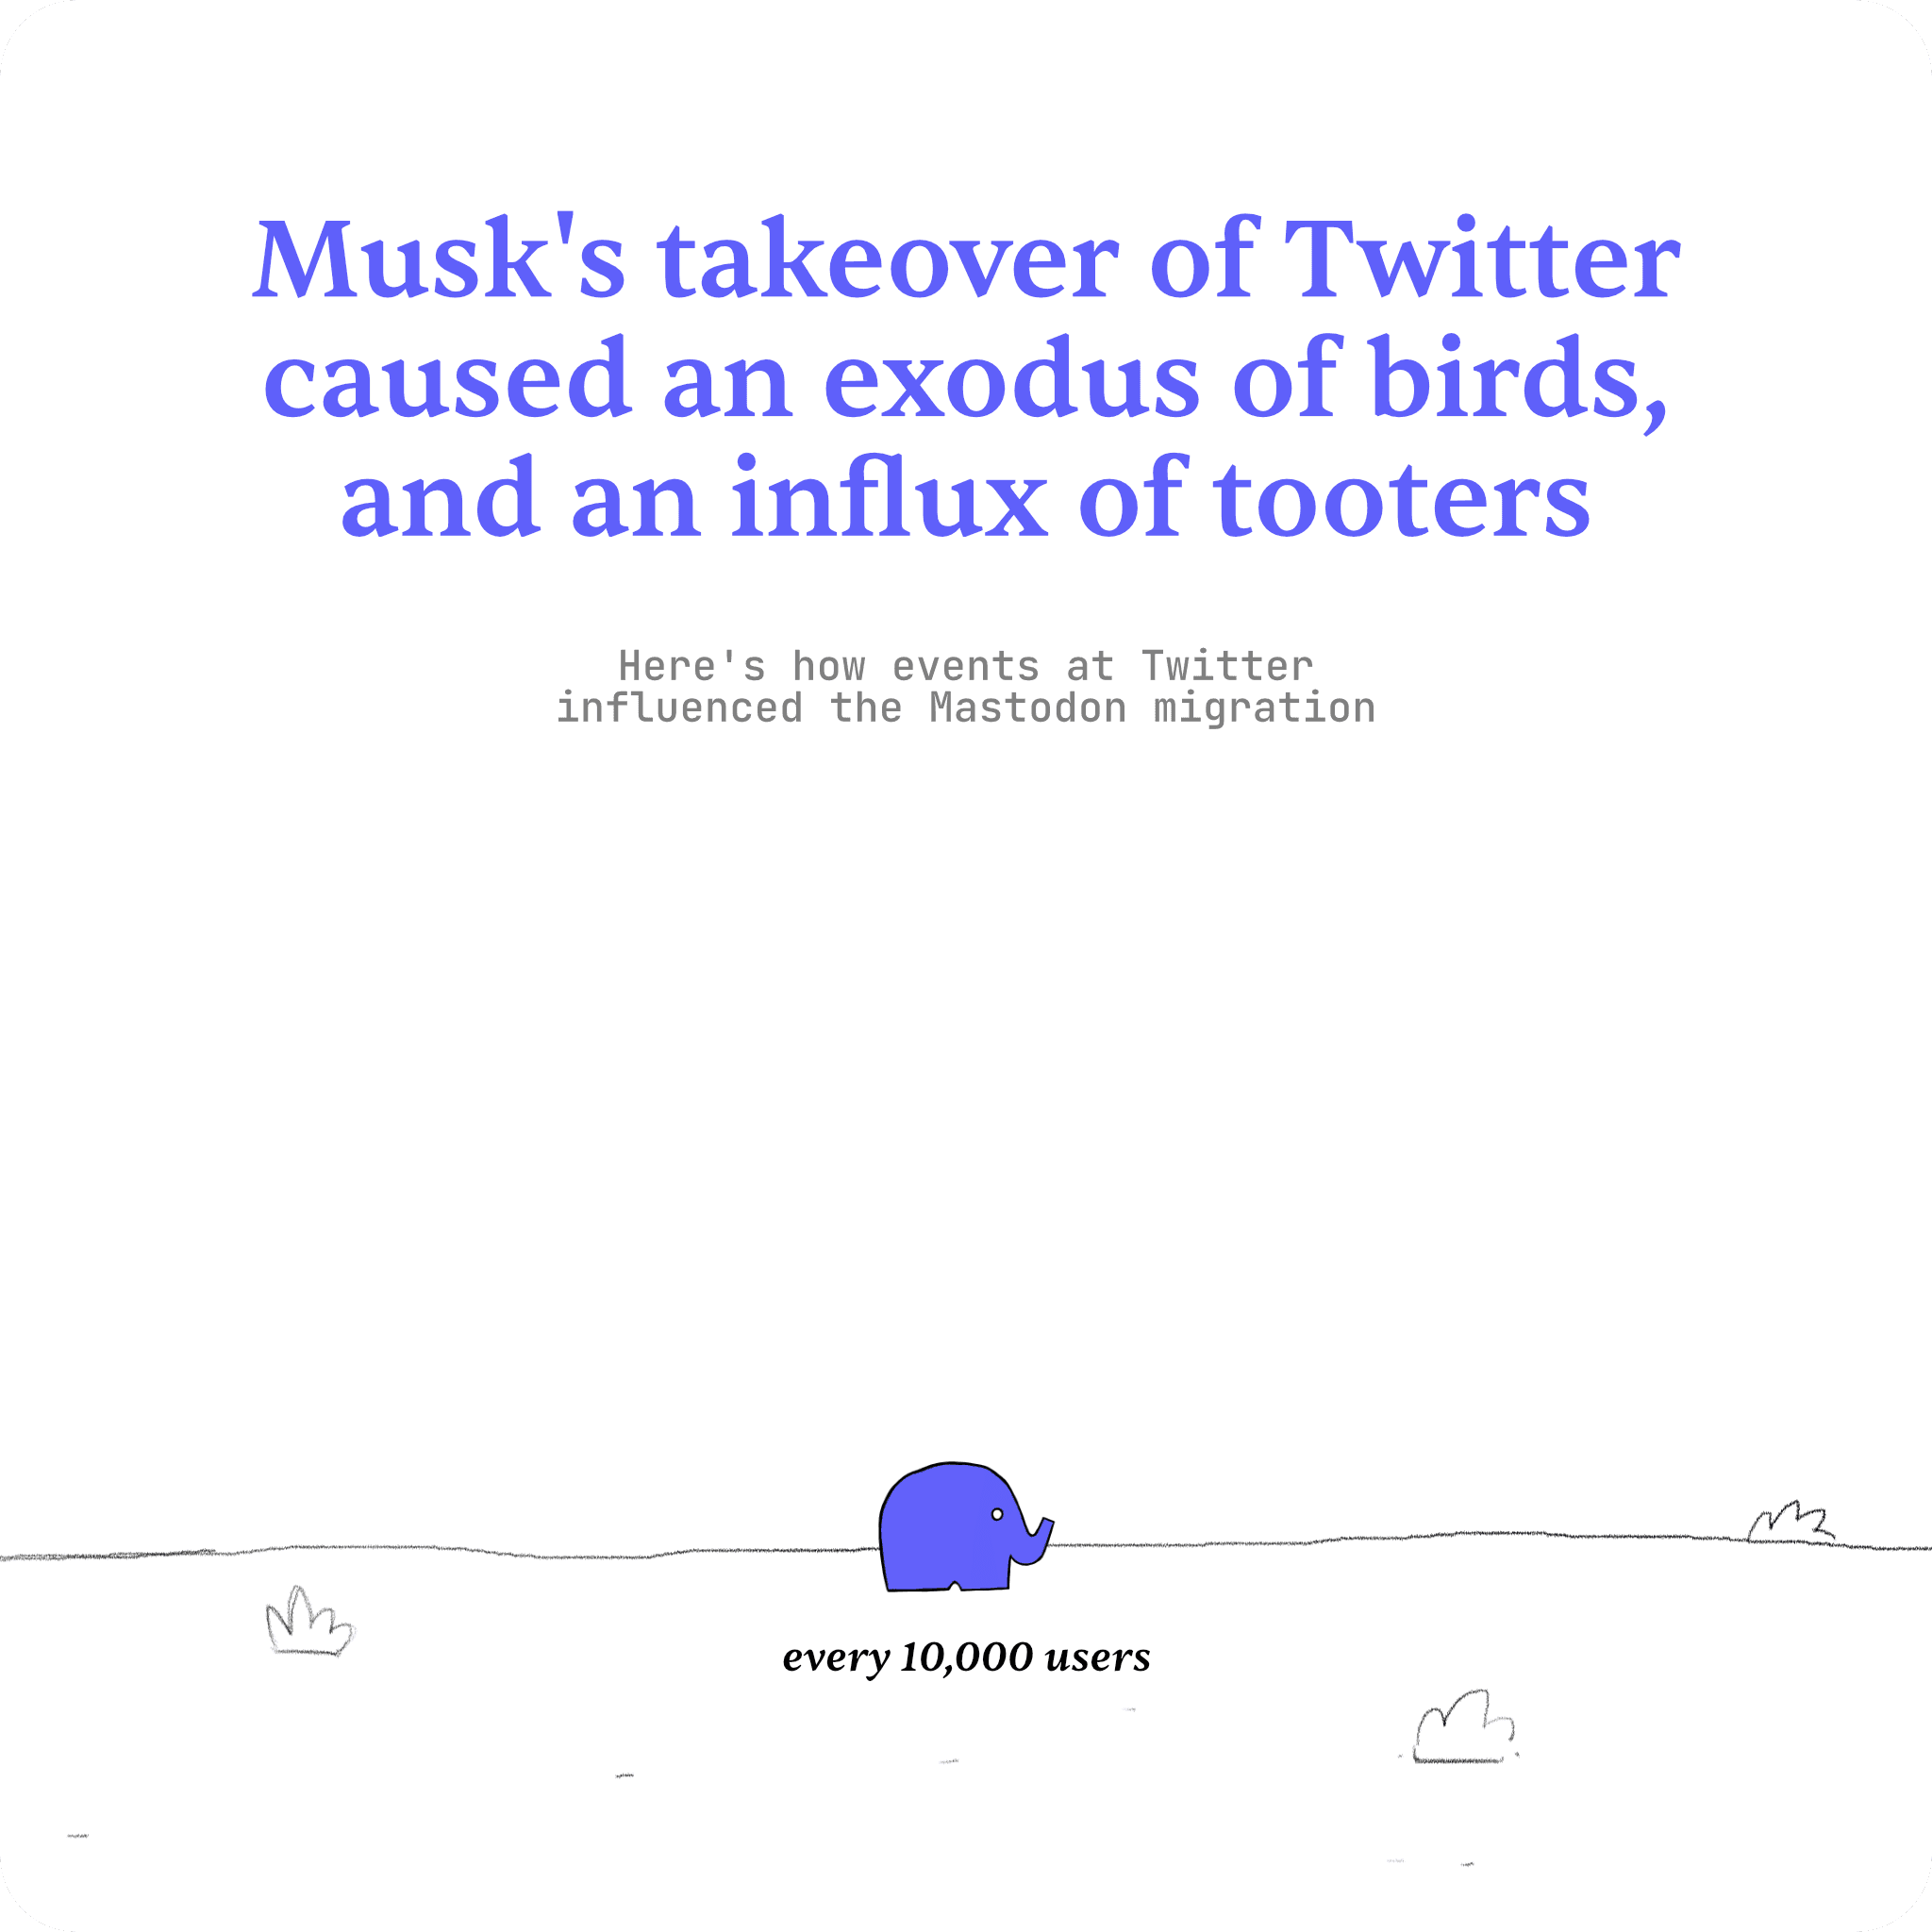
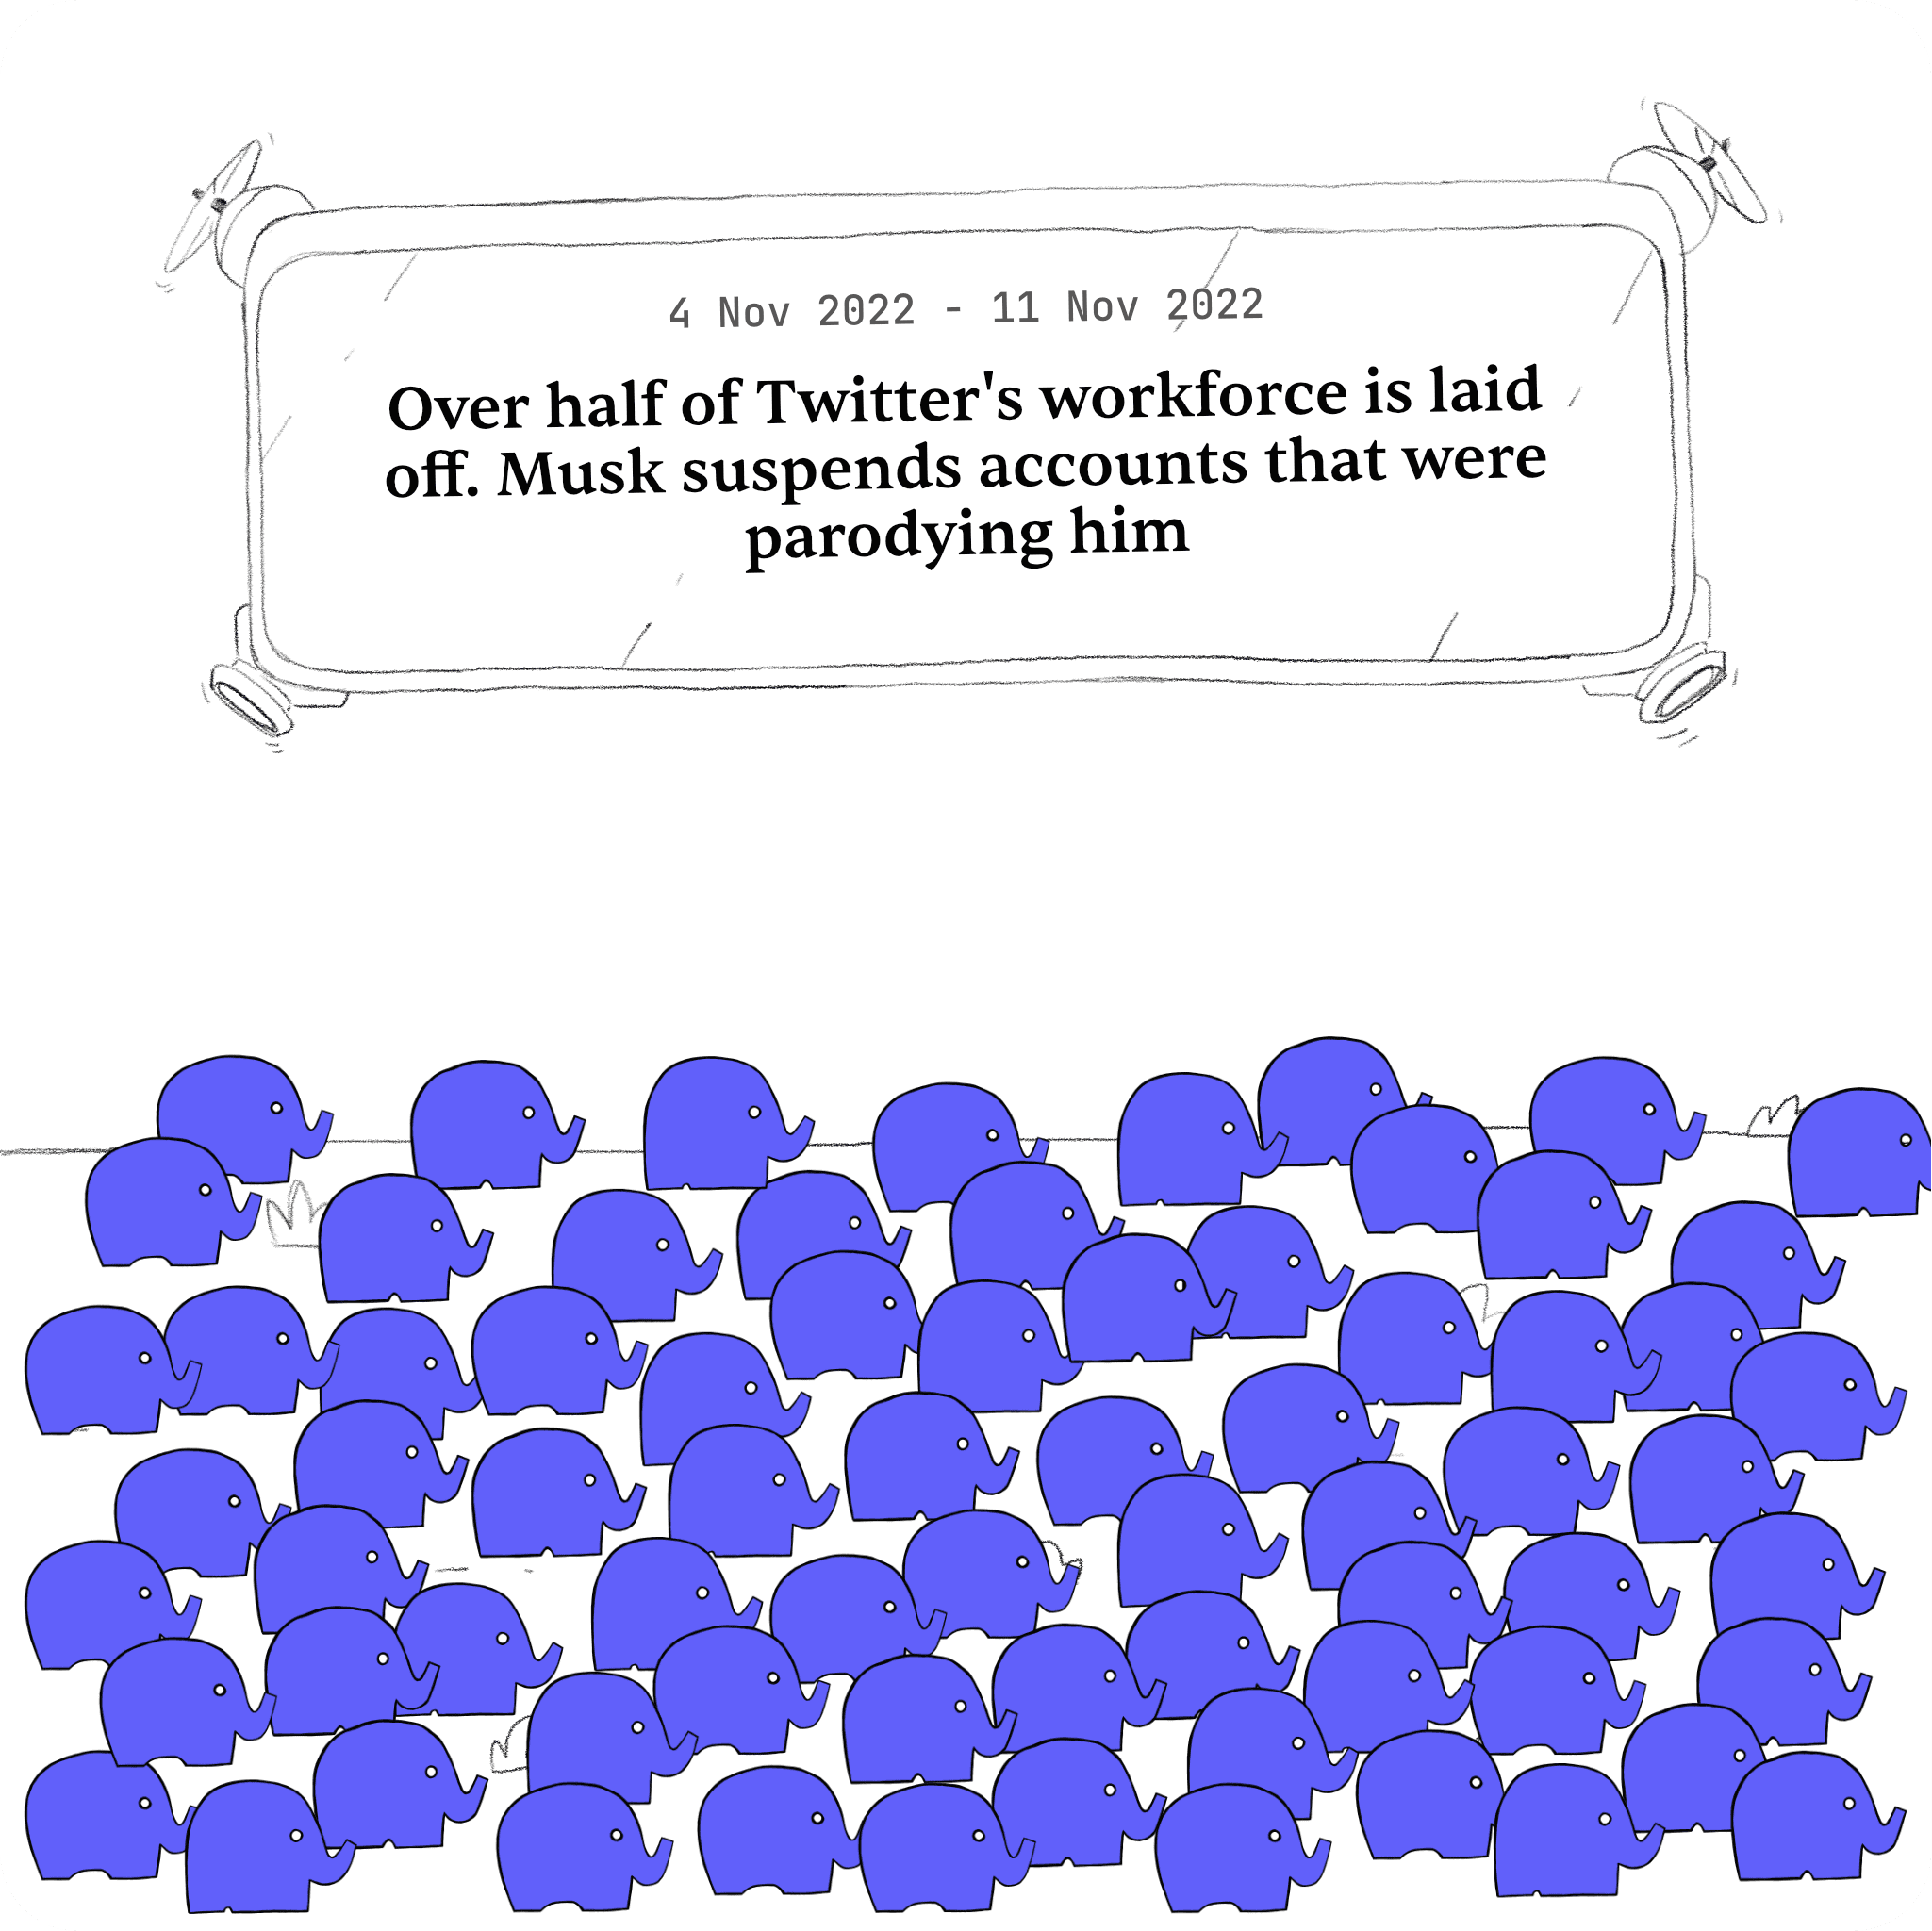
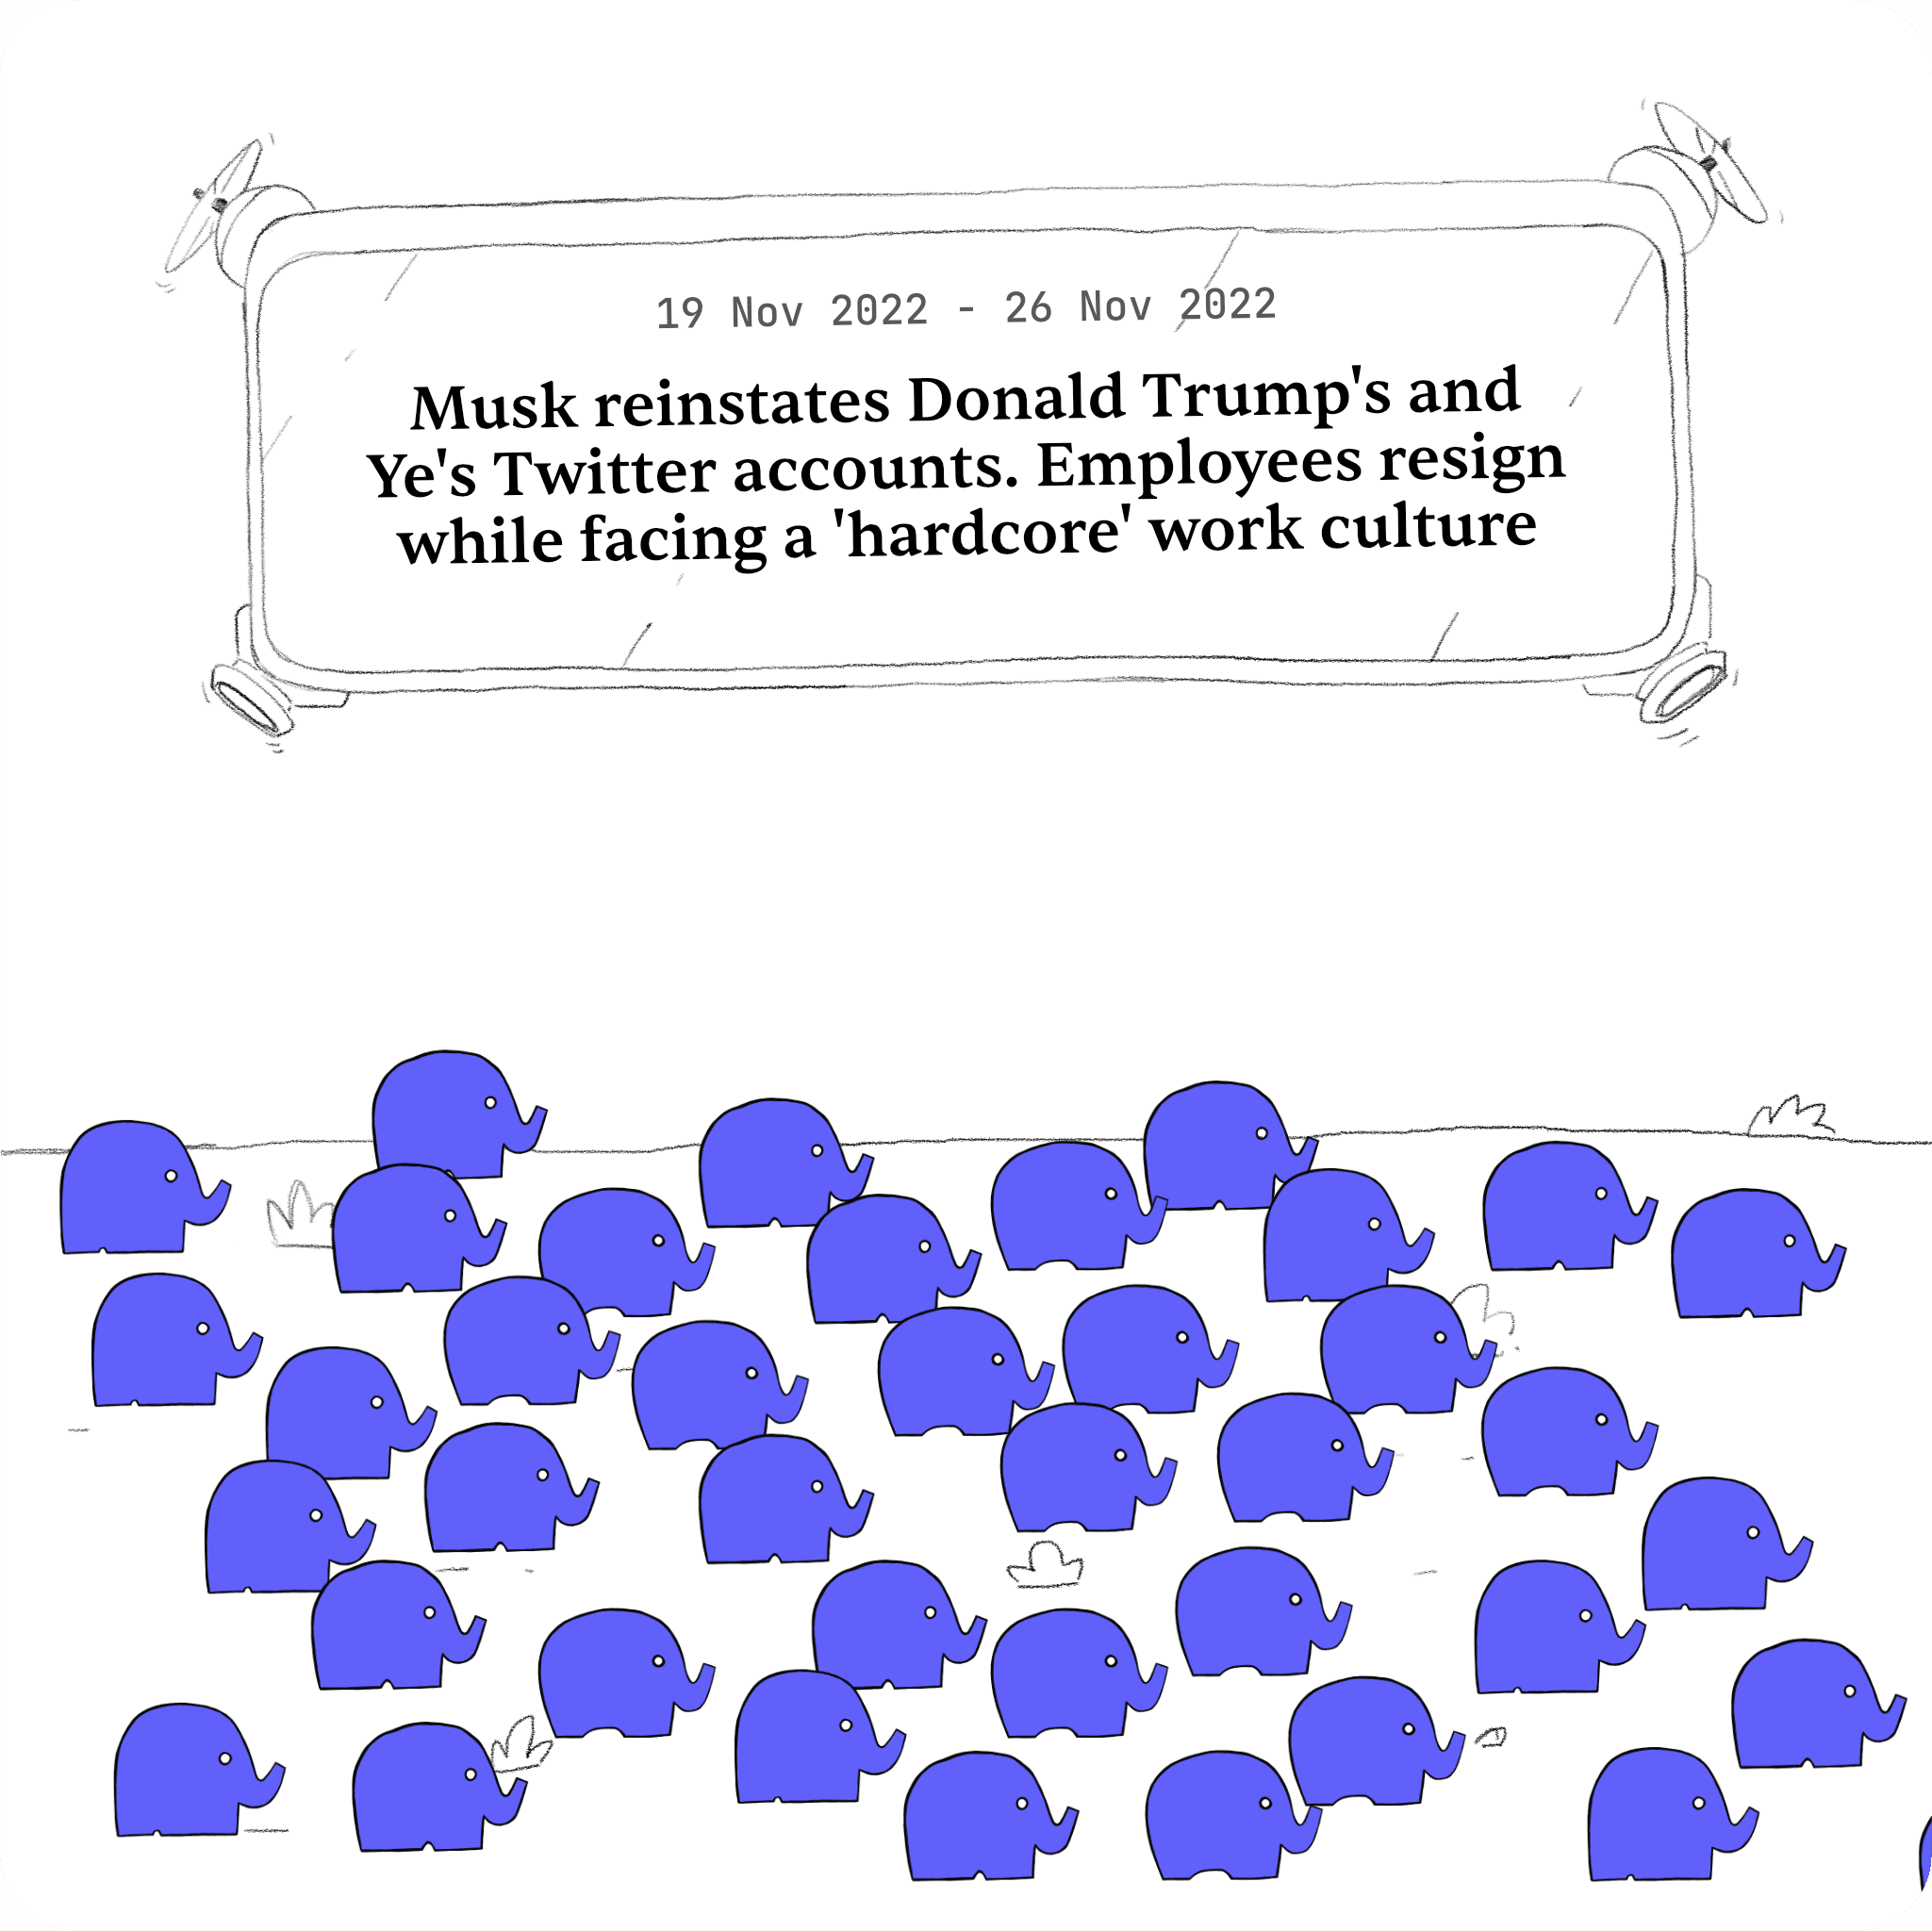
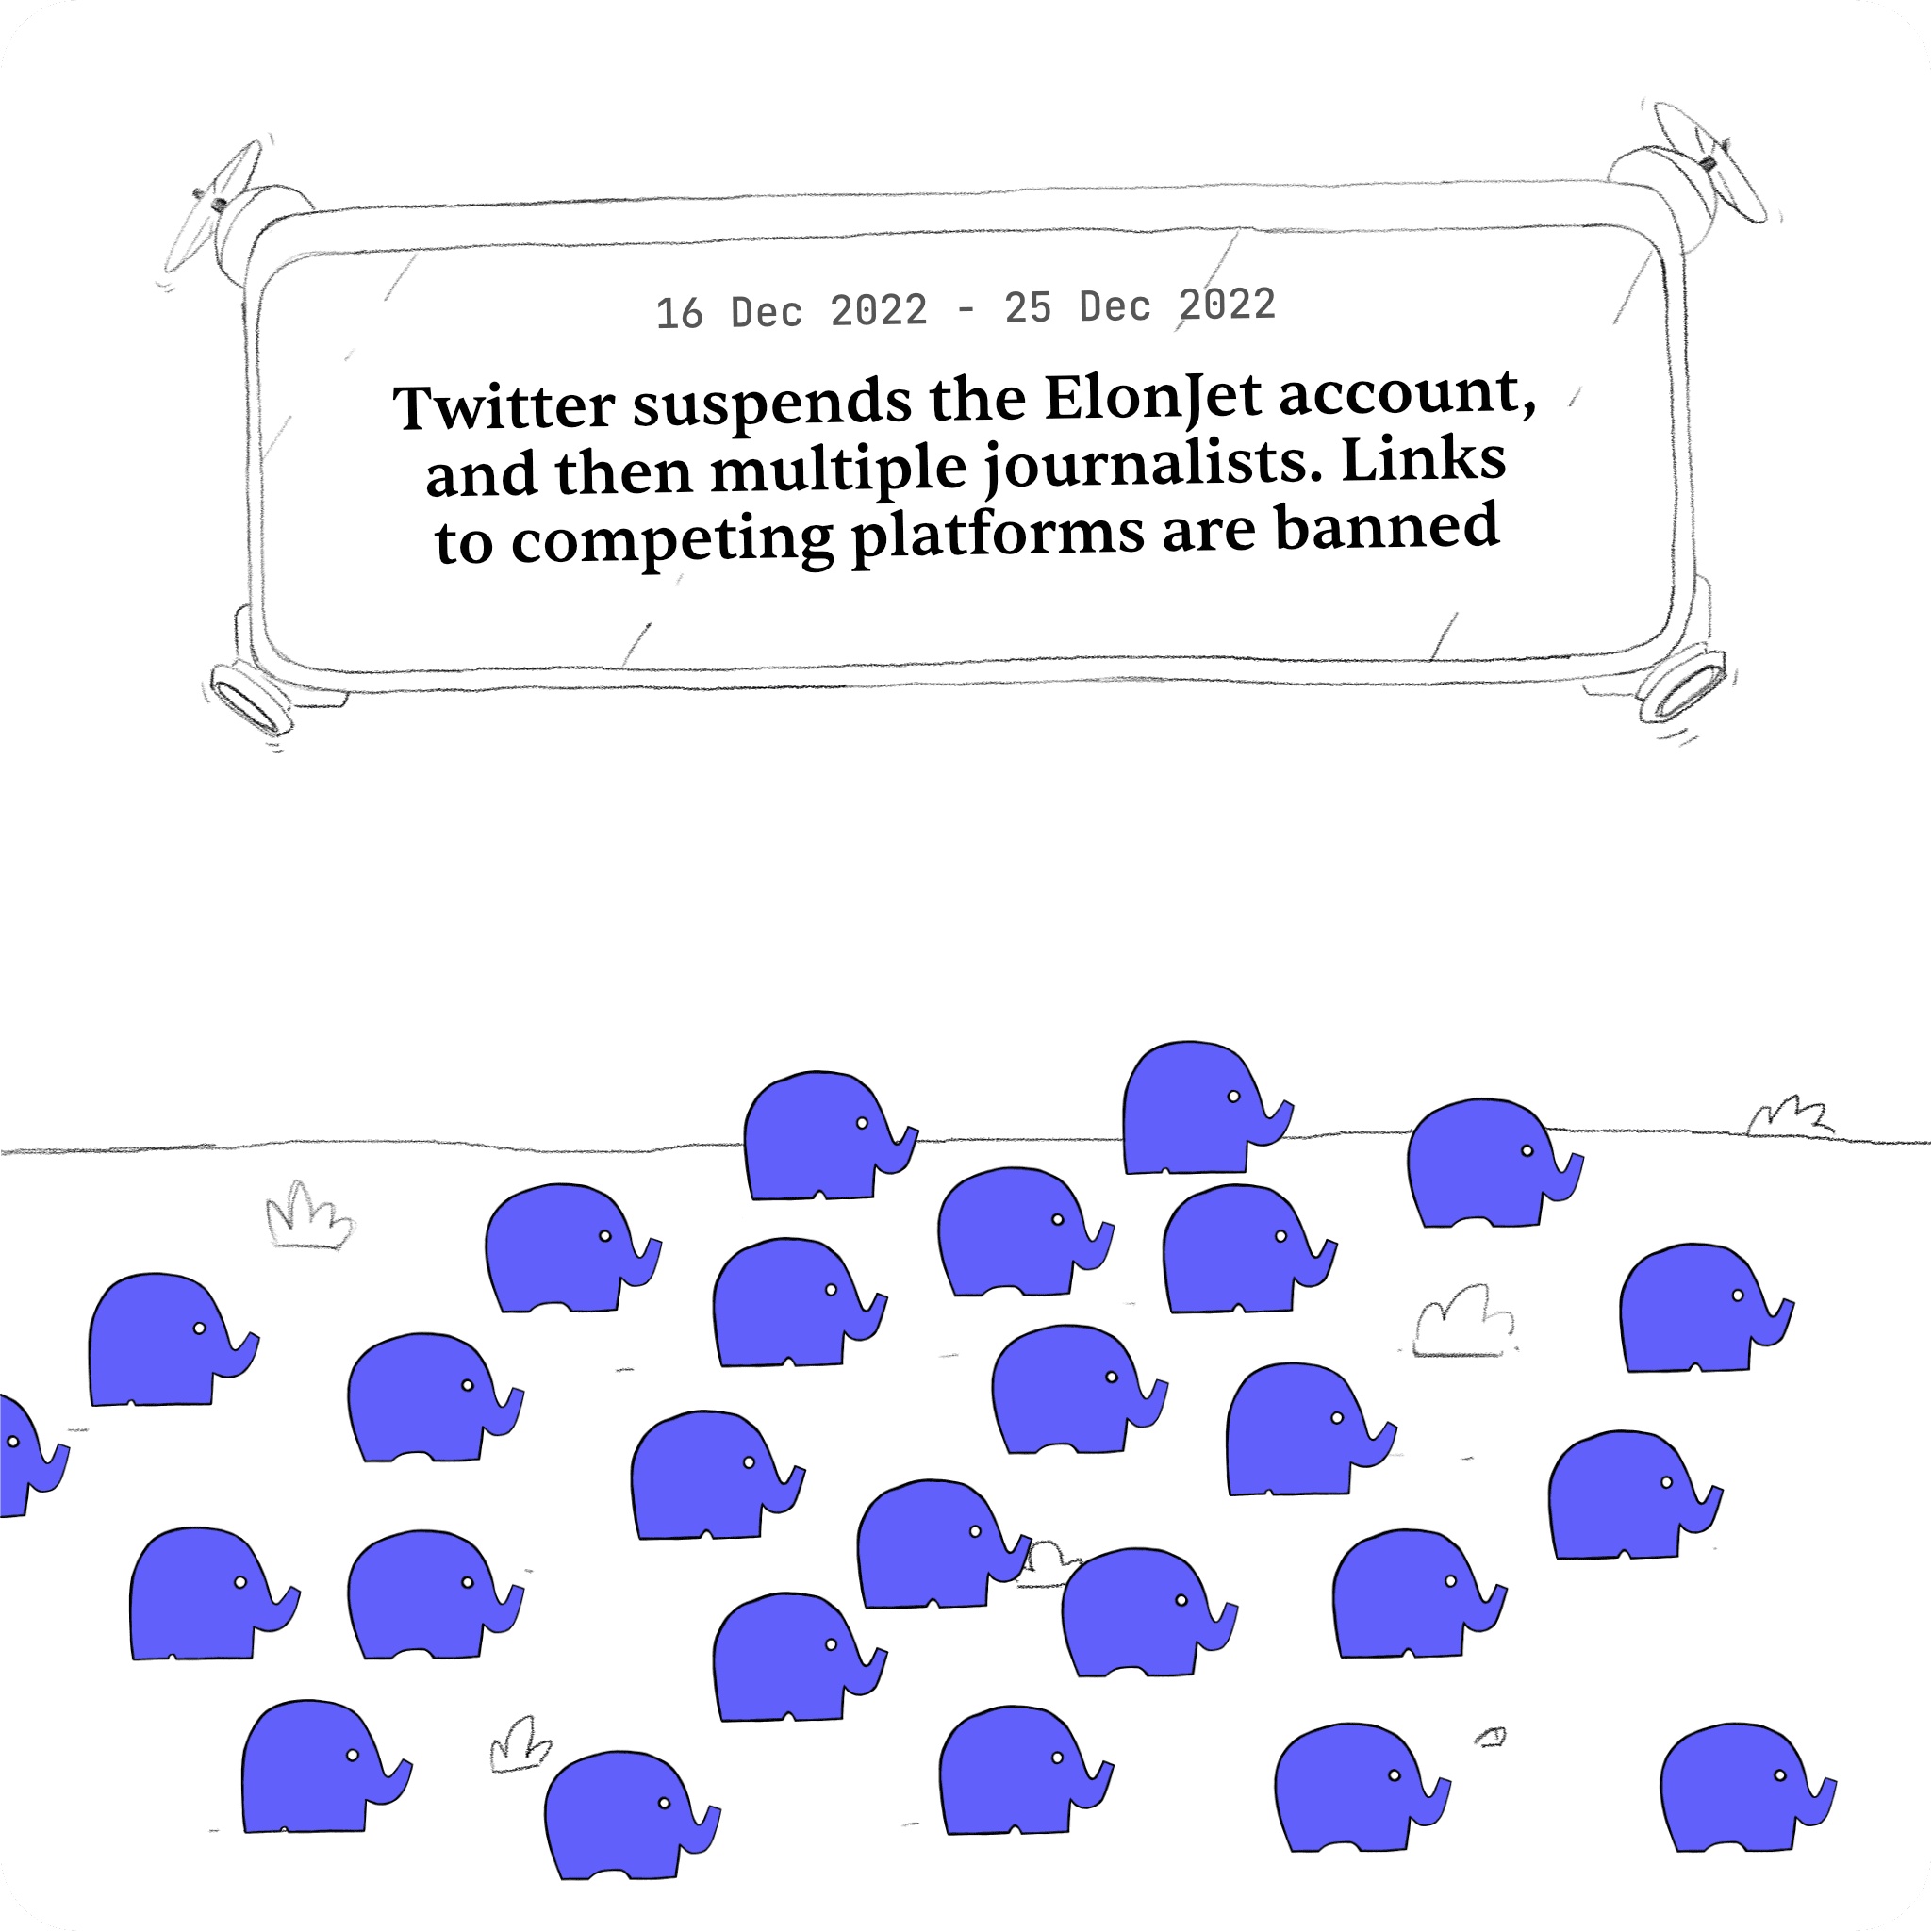
The Great Mastodon Migration
Counting the number of users that joined Mastodon following Musk's takeover of Twitter. I used the Wayback Machine to gather monthly data from Mastodon's stats API

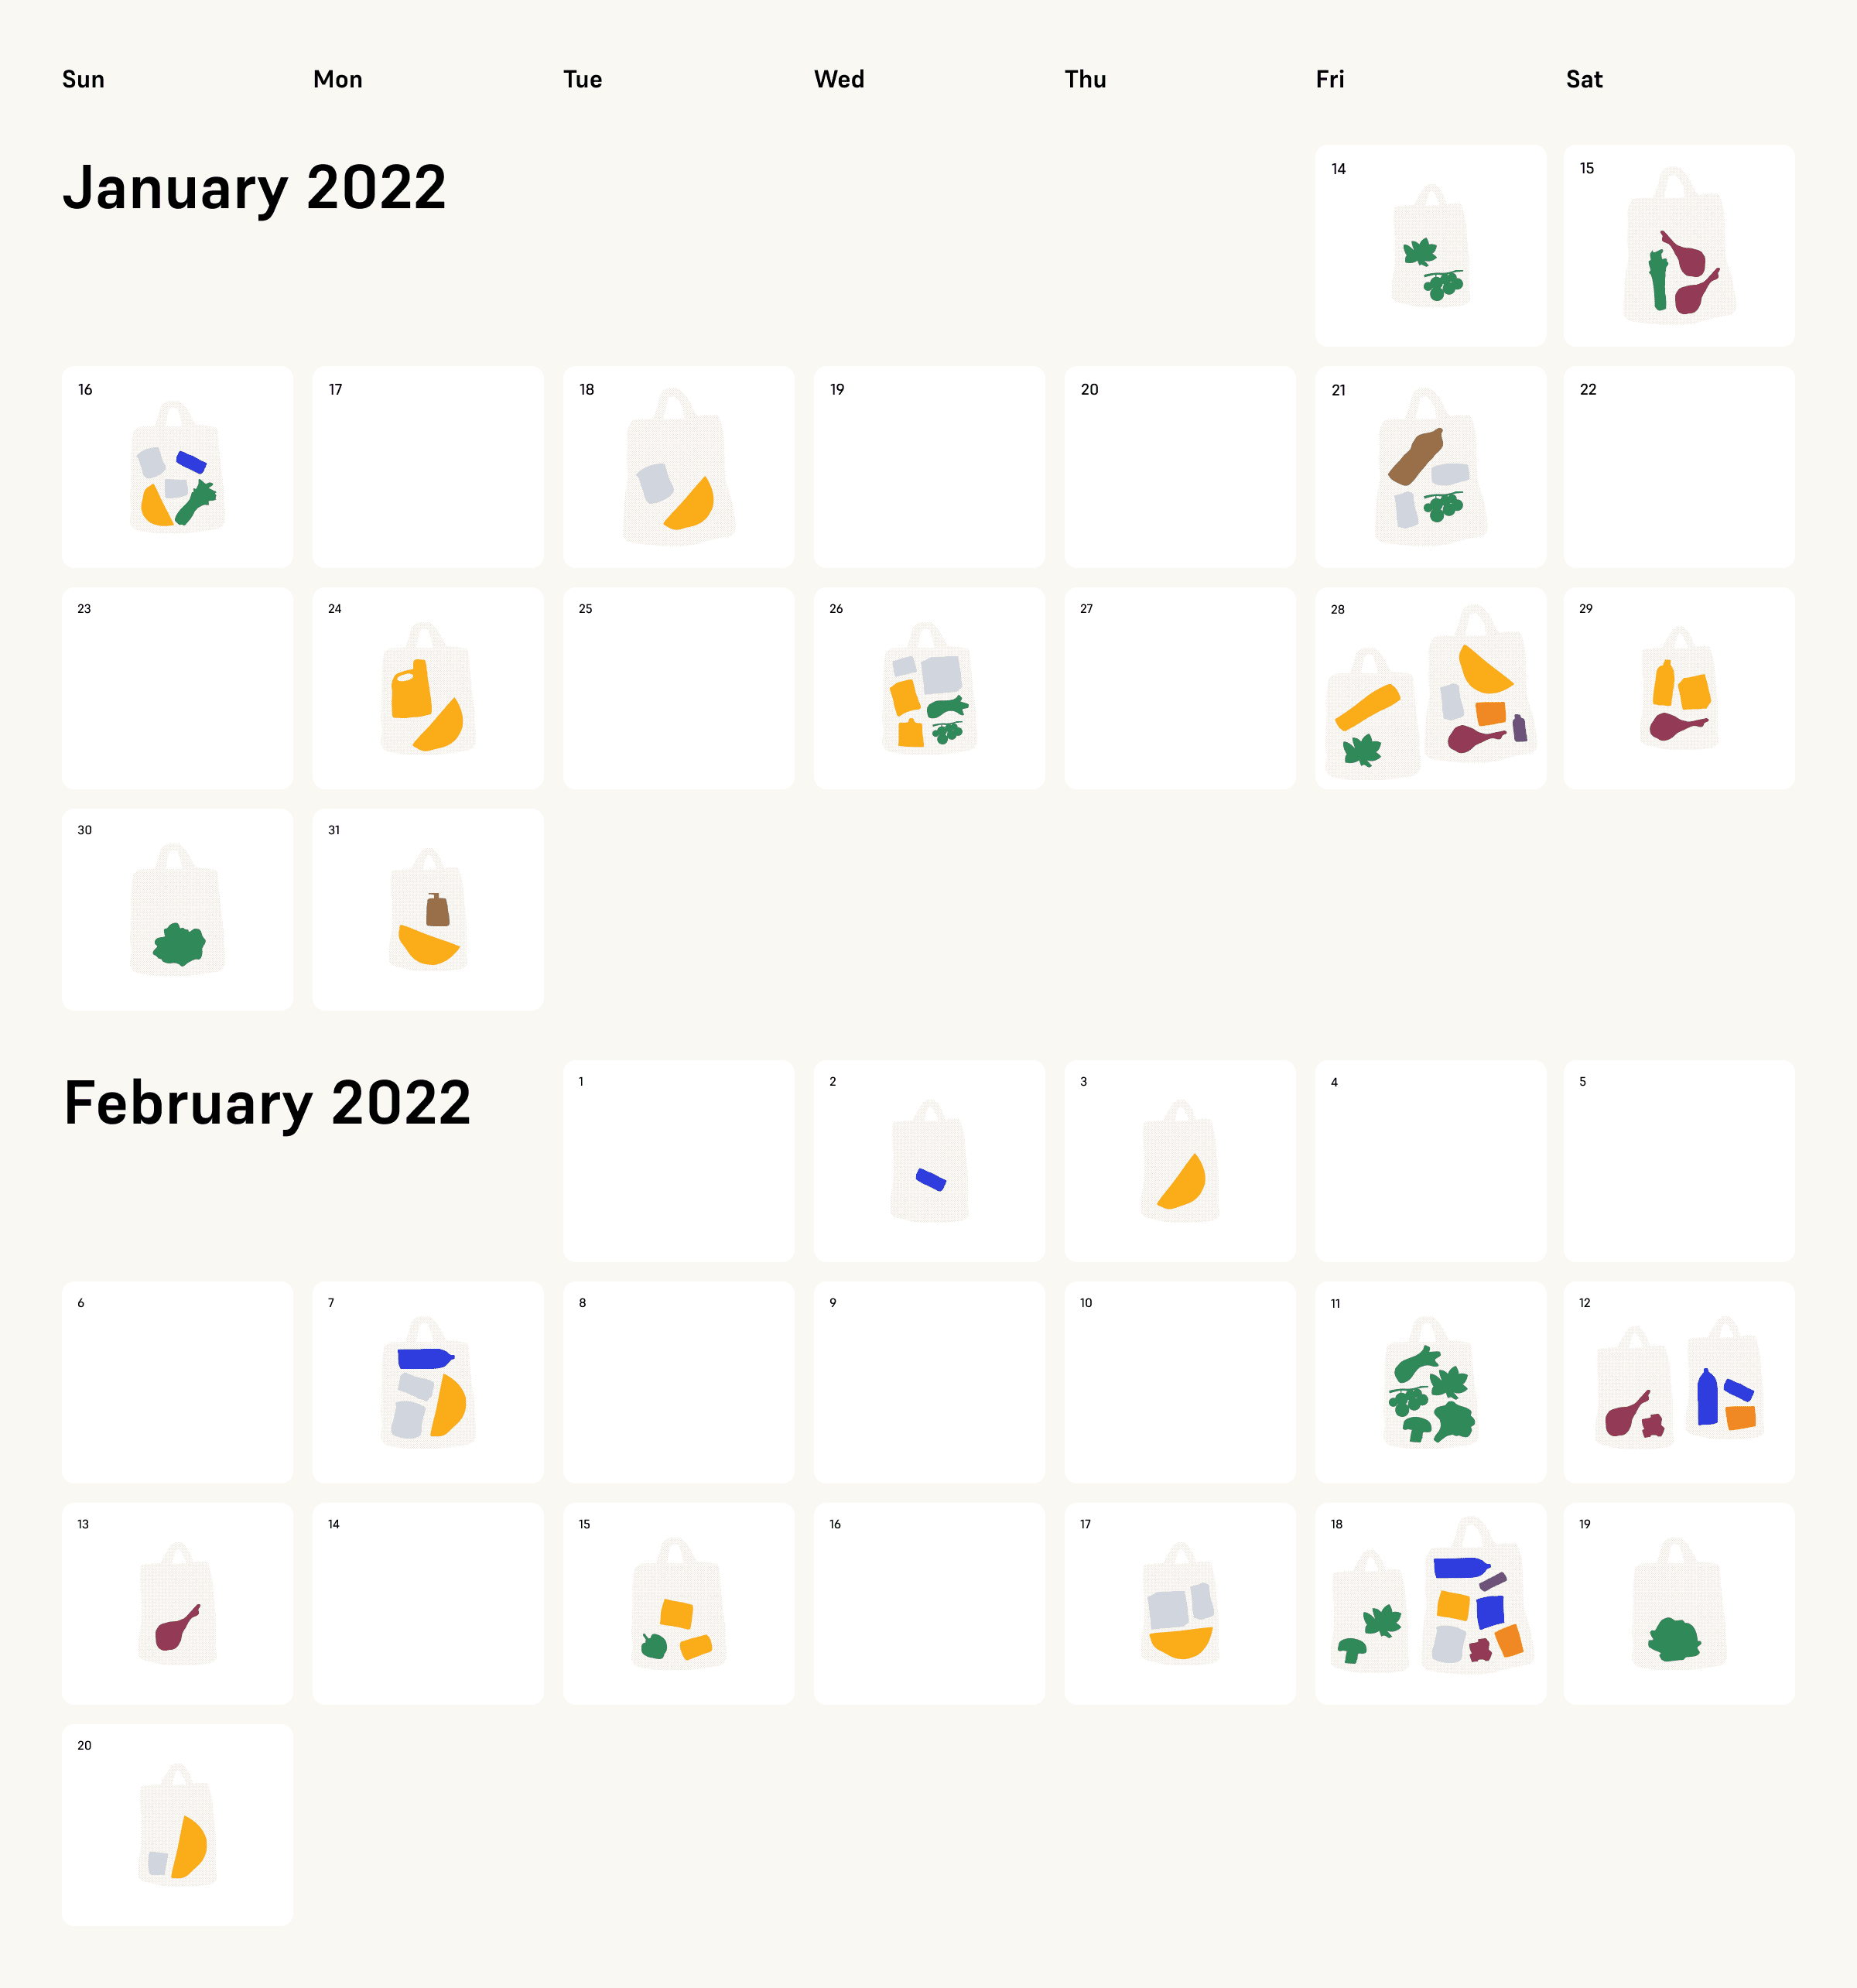
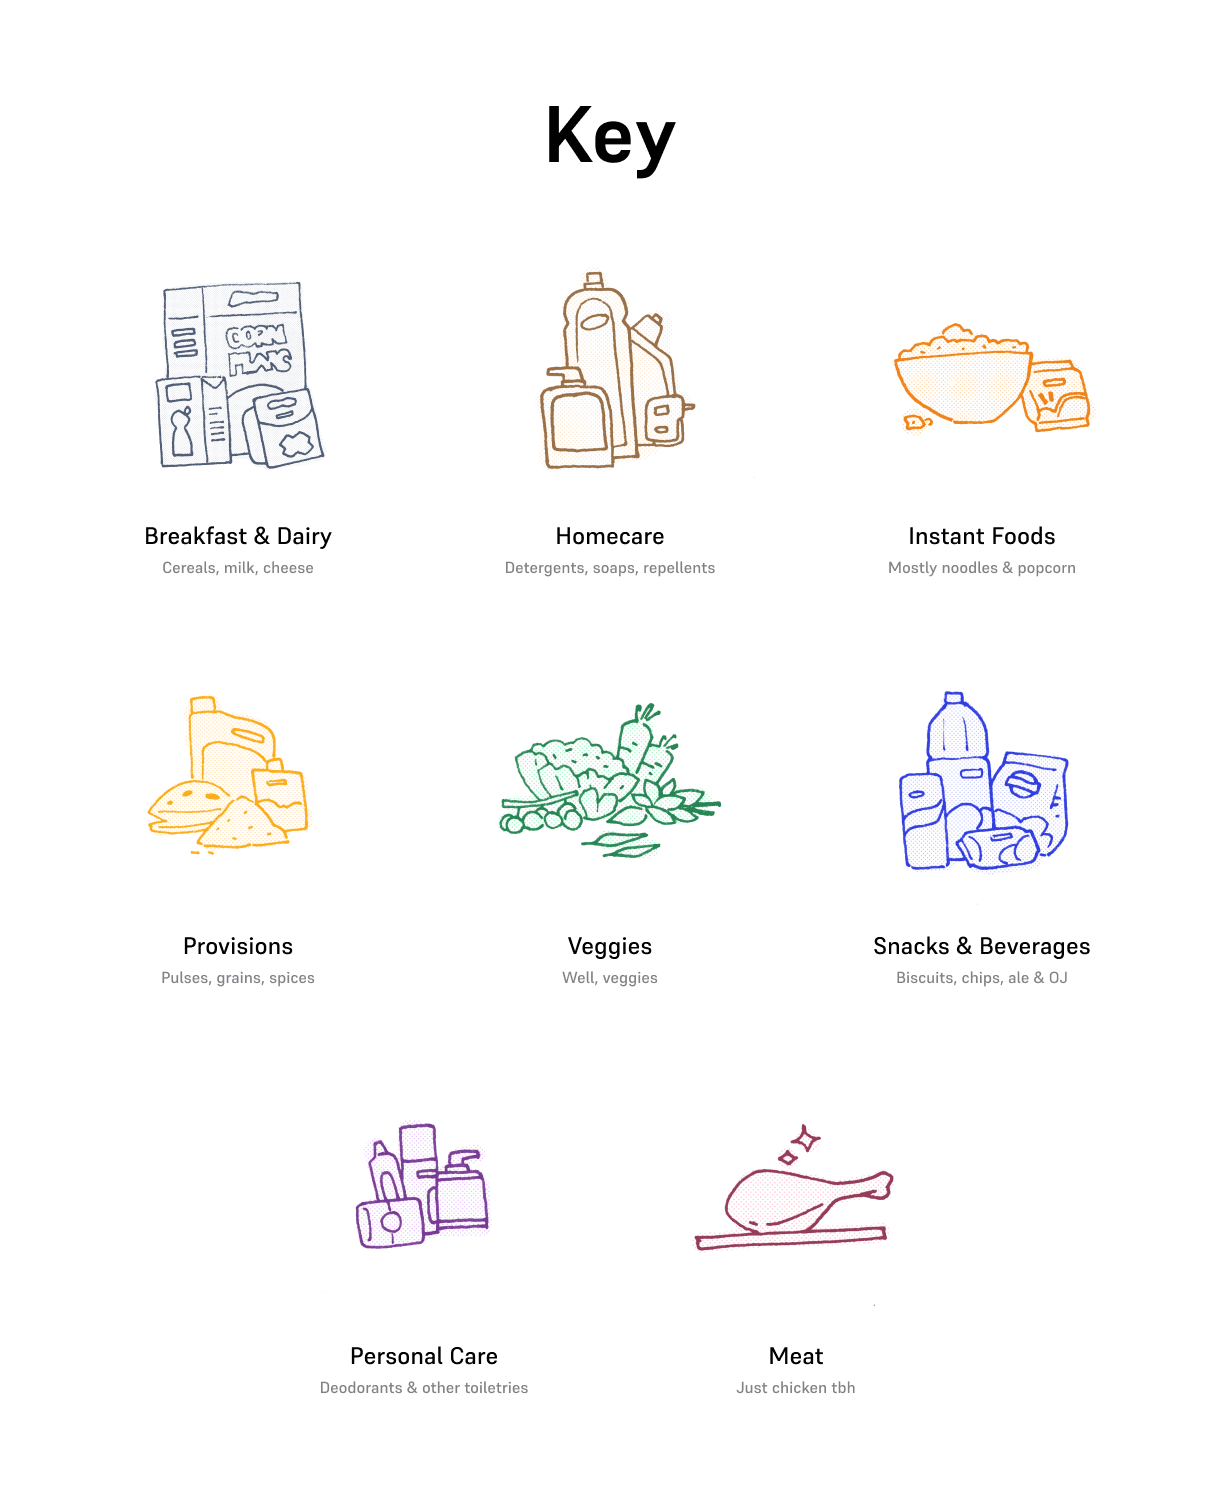
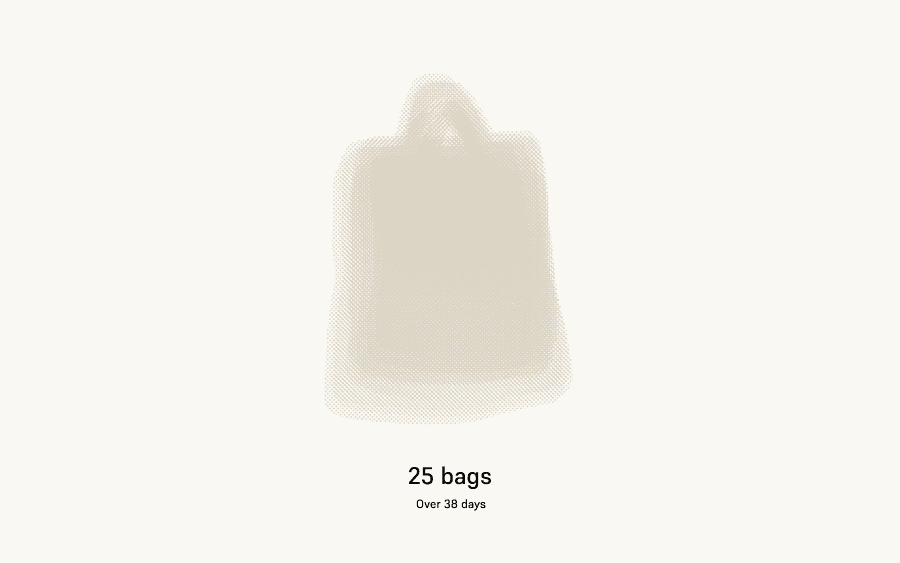
Dunzo Deliveries
I tracked our grocery deliveries over a month. All those cloth bags were piling up and I had to see what our orders said about us, or if they said anything at all
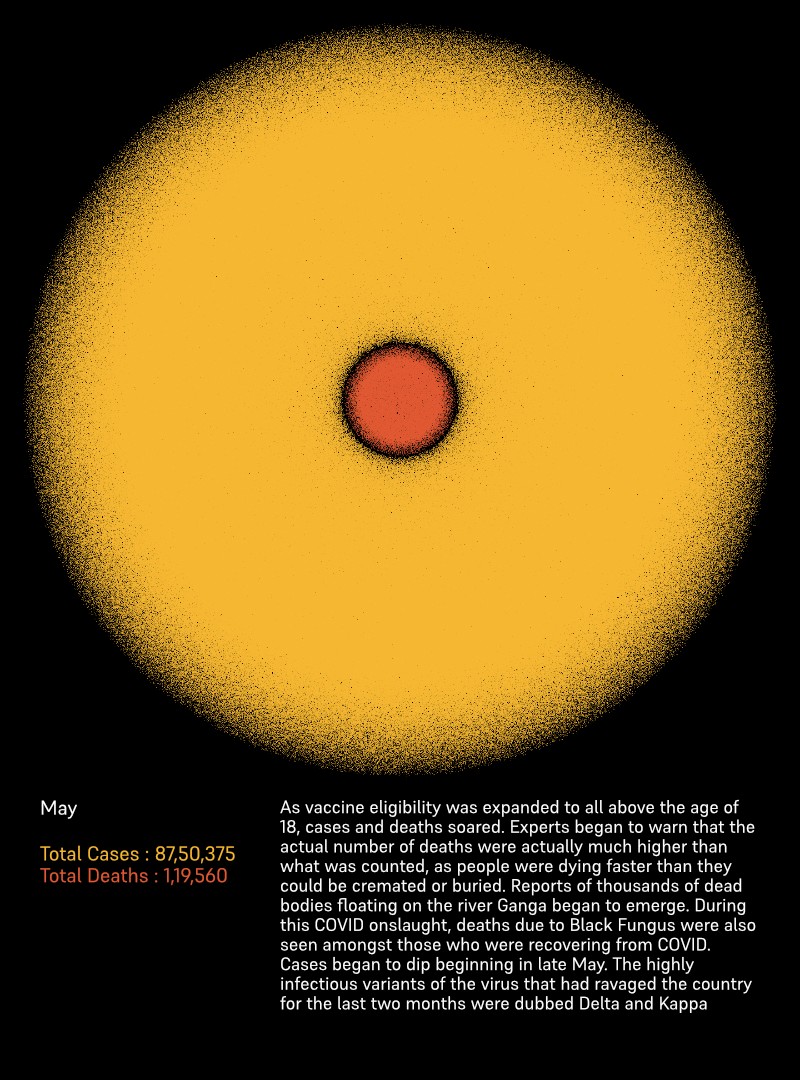
India's 2nd COVID wave
I used public COVID datasets to visualise the year in cases and deaths. I did this to get a better understanding of the scale of India's devastating 2nd wave of infections.
This was my first trial at working with data and code. I used Processing to generate a mix between a nested proportional area chart and a scatterplot. Here's what I learned about visualising COVID data. If you have some feedback, I'd love to hear about it.